Configuring Azure System Managed Identities with Graph Permissions

Recently, I created an Azure Automation Runbook used to integrate with ServiceNow and create DevOps projects and provision users from a service request. As part of the automation, I wanted to be able to either email the requestor upon success, or upon failure, email the support team with details of the issue. Setting up the webhook and passing the details needed wasn’t an issue. However, sending the email was becoming a bit perplexing. According to Microsoft’s documentation, the resolution is to utilize SendGrid. This may be the correct path for high volumes of email, but we’re talking about just a couple emails a week here. Not something that I need (or want) to provision a whole ‘nother resource for. I’ve sent emails via Graph API before, but always using an App Registration and Client Secret or Certificate for authentication. In this case, I wanted to use the System Managed Identity of the Automation Account so that I didn’t have to worry about a client secret that expired or a certificate that had to be renewed.

The Problem

Normally, when you view a typical App Registration, you can add whatever permissions you need and, if needed, grant admin consent.

However, with a managed identity, there is no “+ Add a permission” button:

Solution

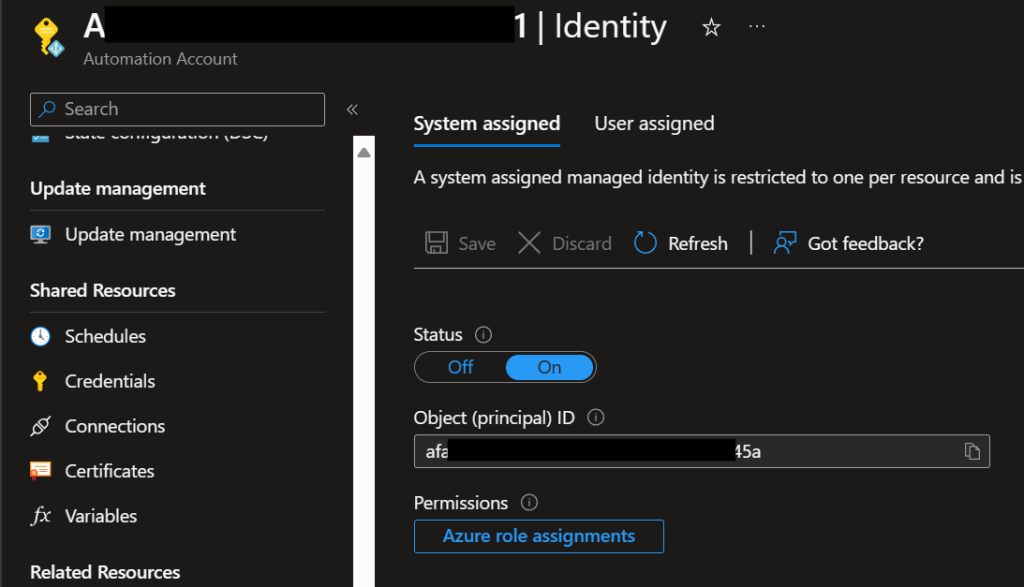
Interestingly enough, we can actually add permissions to a managed identity using PowerShell and the Az Module. First, navigate to the resource in question and click on Identity under the Account Settings heading.

Copy/make note of the Object ID. Next, open up PowerShell and run the following commands:

#Make sure you have appropriate permissions to perform these actions
1> Connect-AzAccount

2> $Graph = Get-AzADServicePrincipal -Filter "DisplayName eq 'Microsoft Graph'"

If we output the value of the second command, we should get something like this:

3> $Graph
DisplayName     Id                                   AppId
-----------     --                                   -----
Microsoft Graph 1ecxxxxx-xxxx-xxxx-xxxx-xxxxxxxxxe46 00000003-0000-0000-c000-000000000000

The Id will be unique for your tenant, but the AppId should always be 00000003-0000-0000-c000-000000000000 (At least for Graph). Next, we need to pull a list of the Permission IDs that we want to grant to our Managed Identity. In our case, we are interested in Mail permissions, but you can adjust this filter (or omit it completely) to return permissions that tickle your fancy.

4> $Graph.AppRole | Where-Object {$_.value -like 'mail.*'} | Select-Object Value,Id

Value              Id
-----              --
Mail.Read          810cxxxx-xxxx-xxxx-xxxx-xxxxxxxx0d01
Mail.ReadBasic     6be1xxxx-xxxx-xxxx-xxxx-xxxxxxxx140a
Mail.ReadBasic.All 693cxxxx-xxxx-xxxx-xxxx-xxxxxxxx42ef
Mail.ReadWrite     e2a3xxxx-xxxx-xxxx-xxxx-xxxxxxxx86c9
Mail.Send          b633xxxx-xxxx-xxxx-xxxx-xxxxxxxx7e96

In my case, I just needed Mail.Send. Next, we’ll grant our application that Graph role:

5> New-AzADServicePrincipalAppRoleAssignment -ServicePrincipalId afa1xxxx-xxxx-xxxx-xxxx-xxxxxxxx045a -AppRoleId b633xxxx-xxxx-xxxx-xxxx-xxxxxxxx7e96 -ResourceId 1ecxxxxx-xxxx-xxxx-xxxx-xxxxxxxxxe46

For the parameters, the ServicePrincipalId is the ObjectId of the system managed identity. AppRoleId is the Id from the $Graph.AppRole shown in command 3 above. Finally, ResourceId is the ADServicePrincipalId for Graph shown in command 4. Once you run that command, you should be able to navigate to your application in Entra ID and enter the Object ID in the search box. From there, under Permissions from there, we should now see the permission(s) we just added.

Now, when we work in our Azure Automation Runbook, we can send email via Graph. Because we are running in an Application context, we need to specify the account that we are sending mail as. I would recommend setting up a shared mailbox and then limiting the access to just that mailbox in the M365 admin portal, but here’s the quick and dirty code to send an email using an Azure Automation Runbook.

#Connect to Azure with our System Managed Identity
Connect-AzAccount -Identity

#Get a GRAPH Token
$Token = Get-AzAccessToken -ResourceTypeName MSGraph

#Create Our Header
$Header = @{
  'Authorization' = "Bearer $($Token.Token)";
  'Content-Type' = 'application/json';
}

#Setup the Body
$Body = @"
  {
    "message": {
      "subject": "Test Email",
      "body": {
        "contentType": "HTML",
        "content": "This is the body of the email"
      },
      "toRecipients": [
        {
          "emailAddress": {
            "address": "[email protected]"
          }
        }
      ]
    },
    "saveToSentItems": false
  }
@"

#Send it
Invoke-RestMethod -Method Post -Headers $Header -Body $Body -Uri 'https://graph.microsoft.com/v1.0/users/[email protected]/sendMail'

Hopefully, this helps.

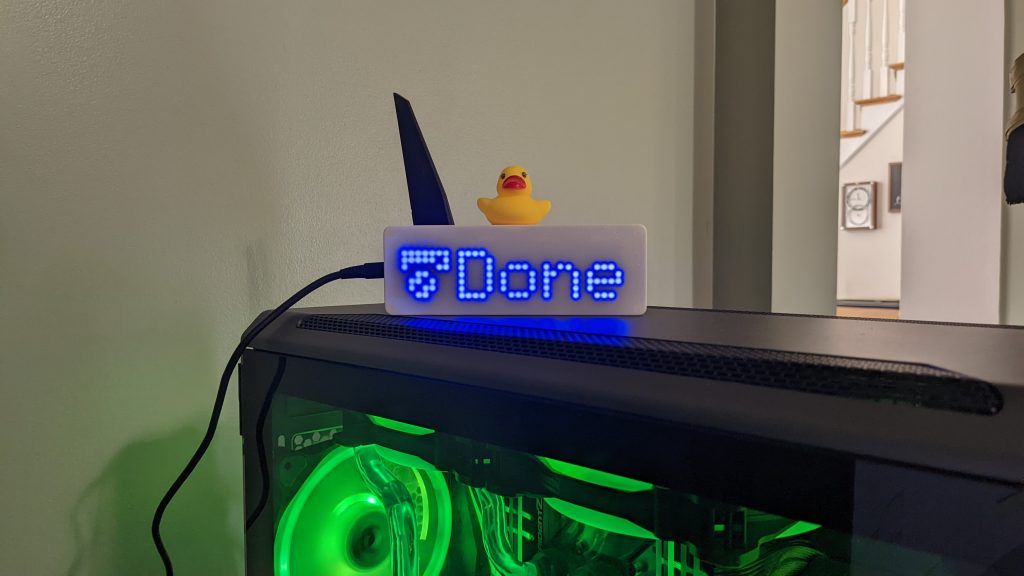
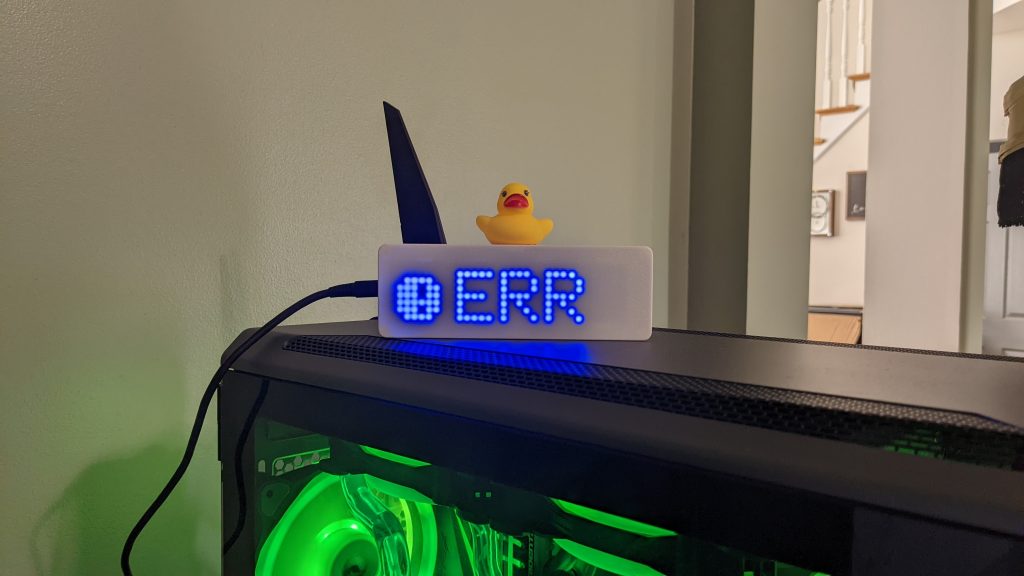
Setting up a ESP8266 NodeMCU based display to monitor 3D printer progress remotely

The Need

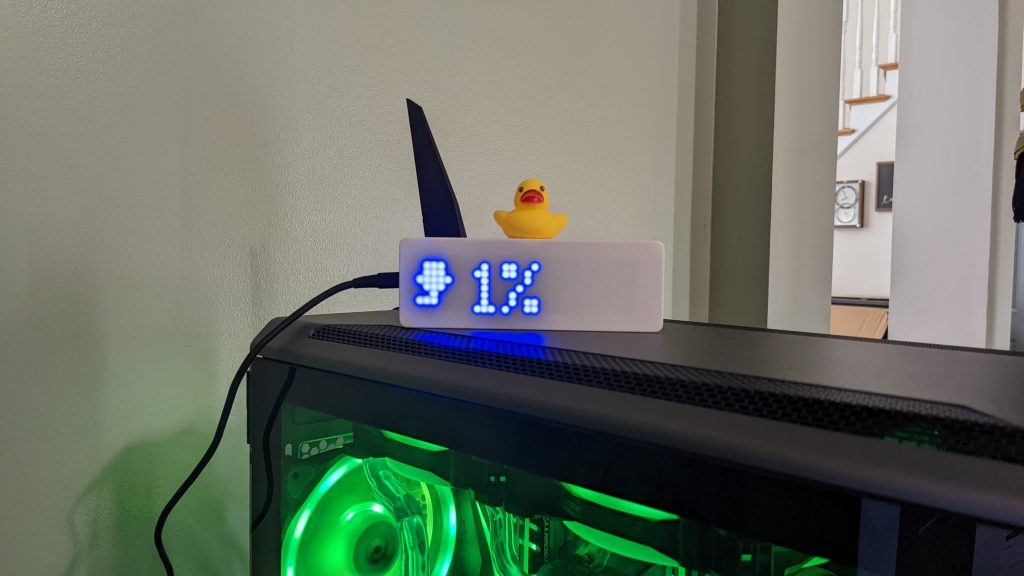
My 3D printer is not located in my home office, and I can’t always step away from meetings or other things that I’m doing to check on it. Now, I know what you’re thiniking. Why not just use Klipperoid on your phone? That does indeed work… but then I have to pickup my phone, unlock the screen… Yeah, I’m lazy. Previously, I had used a zigbee RGB lightbulb to indicate status with no real way to display progress. I could have adjusted the bulb brightness, but let’s face it, I can’t tell the difference between 54% and 55% brightness to know what number it’s trying to convey to me. What I wanted was something that I could quickly glance at and know the state of the printer. At first, I thought about using an addressable RGB light strip, but price, portability, and implementation quickly shot that down. After a bit of searching, I came across the ESP8266 devices. I love me some IoT, and Home Assistant with the ESPHome addon looked like a perfect match. It was also cheap to play with. For less than $20, I could build what I needed and if it didn’t work, I didn’t break the bank and would likely use the chips elsewhere.

Bill of Materials

To implement this project, we need to get a whopping two items:
ESP8266 NodeMCU v2 12F – $3.60 per piece (sold in bulk for $36/10)
MAX7219 LED Matrix Display – $11
If you want to save some money, and don’t mind waiting, you can get both items on AliExpress for quite a bit cheaper.

A Quick Note About NodeMCU Variations

I had purchased a couple other versions of the NodeMCU boards and found a couple things. First, there are a few variations of the boards that are available that use different UART chips. The version 3 boards make use of the CH340 chip which I have found (and others have reported) to be a bit flakey. The version 3 boards are also an odd size that will not mount to a breadboard without modification or jumper wires. This can make prototyping a bit complicated. They also swap out the two reserved pins for a 5v out and an additional ground. If you use USB to power the board, you can use the VIN and GND pins on the lower left for the same thing. There are also a couple variations of the v2 boards. The most common one uses the ESP-12E chip. I opted to go with the ESP-12F versions. The only difference between the two is the antenna design. Supposedly, the 12F antenna is better optimized. There is also a variation of the v2 board which swaps out the CP2102 for another SiLabs chip.

Wiring

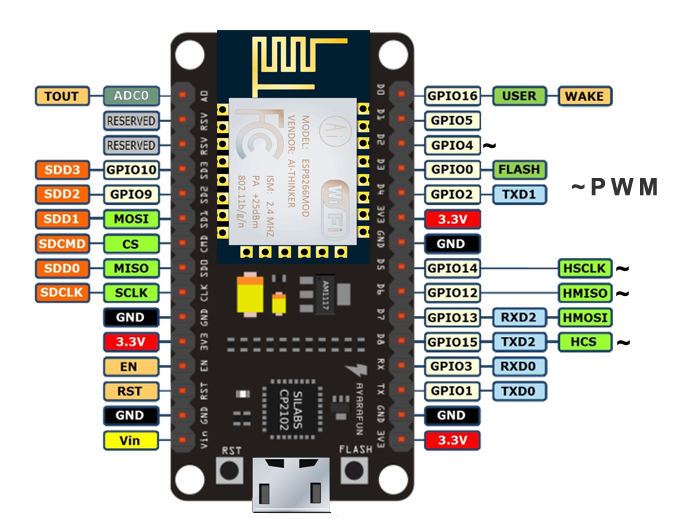
We’ll make use of 5 of the pins on the board.

D0 (GPIO16)
D1 (GPIO5)
D2 (GPIO4)
3V3
GND

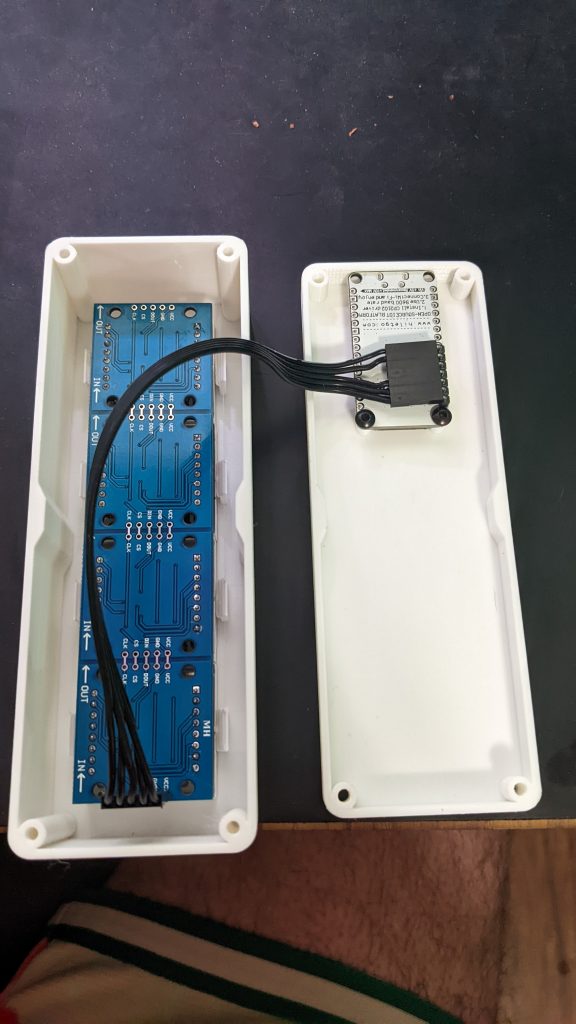
To connect the LED Matrix, I opted to use a 7 position dupont connector instead of seperate 3 and 2 position ones. The wires are connected as follows:
VCC → 3V3
GND → GND
DOUT → D1
CS → D2
CLK → D0
I also replaced the normal pins on the board with the 90 degree version like what came originally on the LED Matrix and rotated the pins on the LED matrix so that they faced along the board instead of away from it. I did this to minimize the extra space needed in the enclosure.

Enclosure

I found a simple enclosure on thingiverse made by knoopx. Since the enclosure was made for a v3, I did have to load it into tinkercad and modify the mount points for the nodeMCU. I also found that the tabs that hold the LED matrix in place were slightly loose for my display, but they held it ok, so I didn’t end up modifying that. I also added holes in the back cover to allow the screws to hold the cover together. All screws are standard M3. My modified version can be had on tinkercad. I printed the enclosure using a white PLA to allow the LEDs to shine through. I will likely play with some darker colors in the future as well.

Setting Up Home Assistant

The first thing we need to do is install ESPHome. If you already have ESPHome installed, skip ahead. To install, go to Settings → Add-ons → Add-on Store → ESPHome → Install. Once installed, you may need to restart your HAss instance.

Next, we need to install two fonts. The first font is optimized for matrix displays with blocky characters. The second allows us to utilize the material design icons. To do so, download the two font files below
Material Design Icons
PixelMix
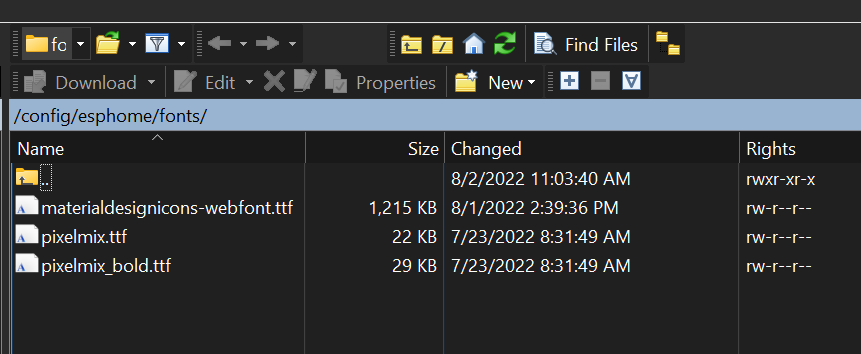
Once the fonts are downloaded, we need to upload them to Home Assistant. To do so, simply use WinSCP or another tool to copy the TTF files to /config/esphome/fonts.

Making Firmware

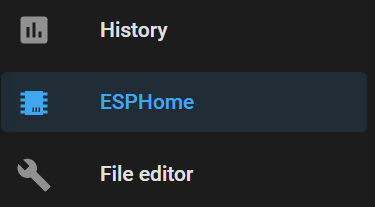
Now, from the left hand navigation menu, we can select ESPHome.

If you haven’t used ESPHome before, the first thing we’ll want to do is setup our Wi-Fi information. To do this, click on Secrets in the top right. Enter in your Wi-Fi information.

# Your Wi-Fi SSID and password
wifi_ssid: ""
wifi_password: ""

Save and close

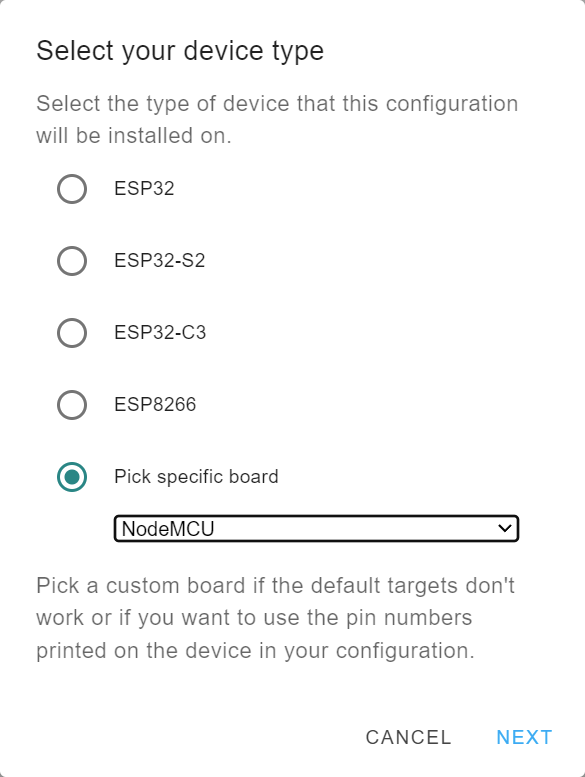
Next click on New Device in the lower right and then Continue. Give your device a name when prompted. Make note of the name as we’ll need to reference it for our automations later. Now we select the board type. We’ll select “Pick specific board” and then “NodeMCU” under ESP8266.

When prompted to install, click Skip.

Click on edit and you’ll be presented with the YAML for the firmware config. You can leave everything alone, and insert the following after captive_portal:

spi:
  clk_pin: D0
  mosi_pin: D1

display:
  - platform: max7219digit
    cs_pin: D2
    num_chips: 4
    intensity: 5
    lambda: |-
      if (id(office_ledmatrix).has_state()) {
        if (id(office_ledmatrix).state == "Soak") {
          it.fill(COLOR_OFF);
          it.print(0, 1, id(icon_font), "\U000F18B8");
          it.print(9, 0, id(digit_font), "Soak");
        } 
        if (id(office_ledmatrix).state == "Done") {
          it.fill(COLOR_OFF);
          it.print(0, 1, id(icon_font), "\U000F042B");
          it.print(9, 0, id(digit_font), "Done");
        } 
        if (id(office_ledmatrix).state == "Error") {
          it.fill(COLOR_OFF);
          it.print(0, 1, id(icon_font), "\U000F0029");
          it.print(9, 0, id(digit_font), "ERR");
        }
        if ((id(office_ledmatrix).state != "Soak") & (id(office_ledmatrix).state != "Done") & (id(office_ledmatrix).state != "Error"))
        {
          it.fill(COLOR_OFF);
          it.print(0, 1, id(icon_font), "\U000F0E5B");
          it.printf(9, 0, id(digit_font), "%s", id(office_ledmatrix).state.c_str());
        }
        if (id(office_ledmatrix).state == "") {
          it.fill(COLOR_OFF);
          it.turn_on_off(true);
        }
      } else {
        it.fill(COLOR_OFF);
        it.turn_on_off(true);
      }

font:
  - id: digit_font
    file: "fonts/pixelmix.ttf"
    glyphs: '"/@&?!%()+=,-_.:°0123456789ABCDEFGHIJKLMNOPQRSTUVWXYZ abcdefghijklmnopqrstuvwxyz'
    size: 8
  - id: icon_font
    file: 'fonts/materialdesignicons-webfont.ttf'
    glyphs: "\U000F0E5B\U000F18B8\U000F042B\U000F0029"
    size: 8

text_sensor:
  - platform: homeassistant
    name: "office ledmatrix"
    id: office_ledmatrix
    entity_id: input_text.office_ledmatrix

Make note of the encryption key. You’ll need that when adding the device later. There may be a few things you want to change in the above code.

font:
glyphs – If you want, you can completely omit this to include every available character. To keep the firmware binaries small, I’ve elected to select only the required glyphs that I’ll use for my display. For the material design icons, you can get a full list of all the glyphs and their IDs. To use them in strings, pre-pend them with \U000. Be sure that any strings that use them are enclosed with double quotes and not single quotes so that they aren’t interpreted as literals.

text_sensor:
name – Change this to whatever you want.
id – this can also be changed to whatever you like. It will need to comply with Home Assistants rules around device naming. If you change this, be sure to update lines 11, 12, 17, 22, 27, 31, & 33 above. Basically, do a find/replace.
entity_id – If you change the id, change this as well to be ‘input_text.<id>’

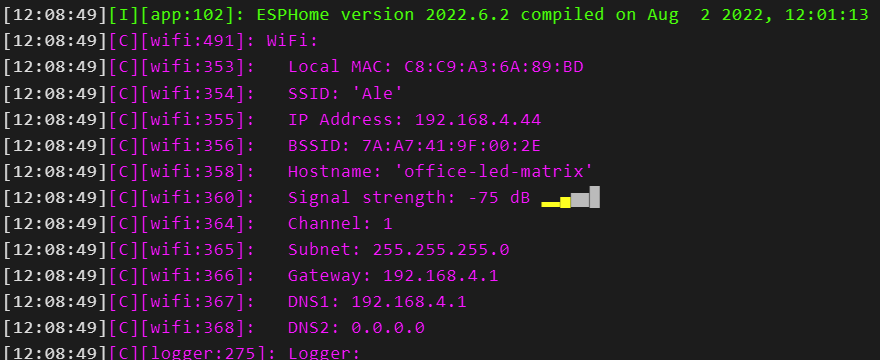
Once you’re happy with the YAML, click Save then Install. Next, select Manual, and Legacy format. Since we don’t have firmware on the board yet, we can’t flash it wirelessly. There is an option to use the ESPWeb interface to do so, but I had issues getting that method to work. I found that using the ESPHome flasher was the easiest way to do the initial flash. Plug your board into your computer and run the flasher with administrative privileges. Select your COM port and then the BIN file that was downloaded after ESPHome compiled it and click flash. Your board will be flashed and you should then see a log. The board will connect to your wifi and you’ll notice your IP Address right under the SSID.

The Helper and Device/Integration

Next we’ll setup the helper in Home Assistant.

In Home Assistant, go to Settings → Devices & Services → Helpers.
Click + Create Helper and select Text as the type.
For the name, enter in the id that you specified in the YAML. In my example, it was office_ledmatrix.
Click Create and you should see your new helper with an Entity ID of something like input_text.office_ledmatrix (the same entity_id as we specified in the YAML).

Next, return to the Integrations screen, and click + Integration. You’ll want to add an ESPHome integration. If your router/computer multicast DNS, you can use the hostname.local, otherwise, use the IP address of the device. After you click submit, you’ll need to enter the encryption key from the devices YAML that we generated earlier.

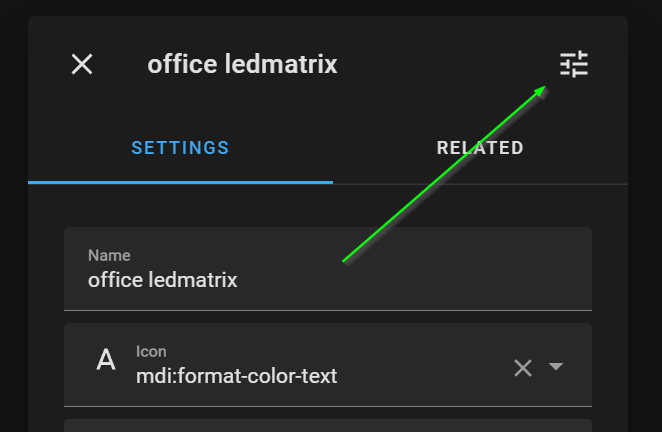
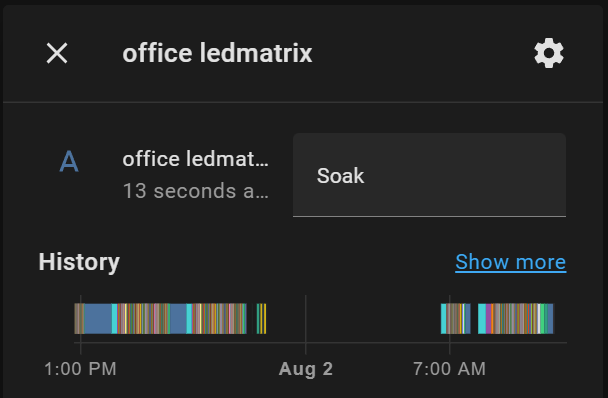
Now you should be all set. To test, we can go back to Helpers, select our helper, and click on the control icon.


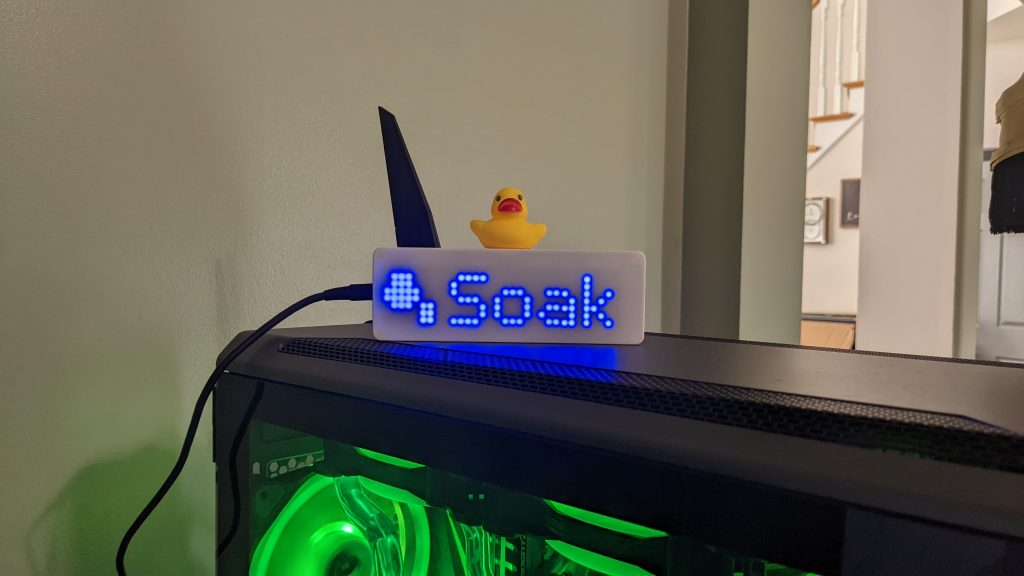
From here, we can manually set the value to test:

The Automations

Finally, we need to setup the Automations. The automations I’ve included below are what I setup in my HAss instance to interface with my printer which runs Klipper and fluidd. If you’re running a different firmware or are using octoprint, you may need to adjust the automations depending on which sensors are available. There are a total of 5 automations. You will likely need to update the device_id and entity_ids to match your setup.

alias: 3D Printer - Soaking
description: ''
trigger:
  - type: running
    platform: device
    device_id: 36c487f404c4b67400b5354516fe7363
    entity_id: binary_sensor.reprap_print_status
    domain: binary_sensor
condition: []
action:
  - service: input_text.set_value
    data:
      value: Soak
    target:
      entity_id: input_text.office_ledmatrix
mode: single

The Soaking automation is triggered when the Print Status starts running. When that triggers, the automation sets the value of our helper to ‘Soak’.

alias: 3D Printer - Printing
description: ''
trigger:
  - platform: state
    entity_id:
      - sensor.reprap_print_progress
condition:
  - condition: state
    entity_id: sensor.reprap_print_state
    state: printing
action:
  - service: input_text.set_value
    data:
      value: '{{ states(''sensor.reprap_print_progress'') }}%'
    target:
      entity_id: input_text.office_ledmatrix
mode: single

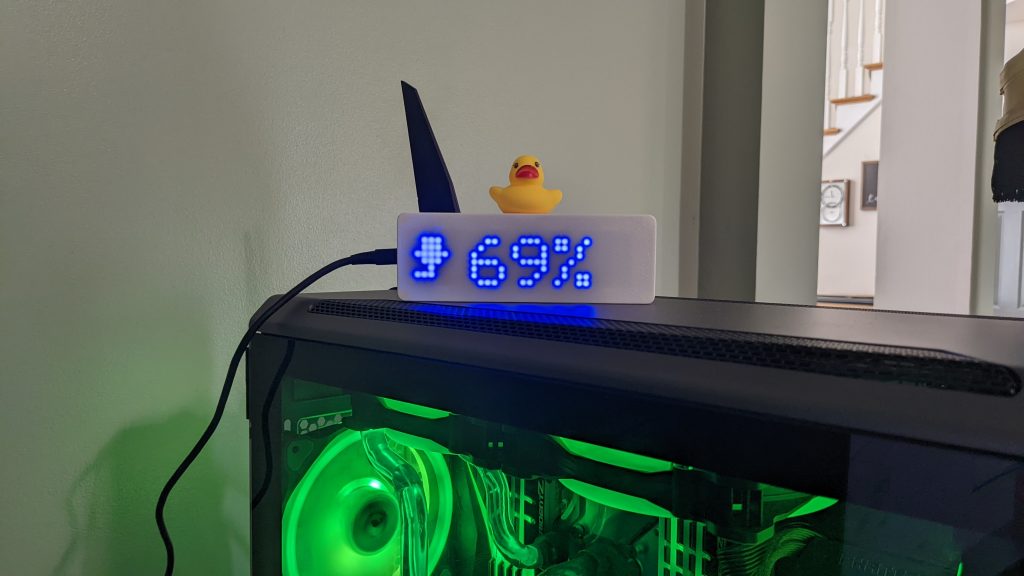
The Printing automation is triggered when the print progress is updated (each %) as long as the state is ‘printing’. Here, we set the value of the helper to the value of the print progress state and append a % sign to the end of it.

alias: 3D Printer - Print Complete
description: ''
trigger:
  - platform: state
    entity_id:
      - sensor.reprap_print_state
    to: complete
condition: []
action:
  - service: input_text.set_value
    data:
      value: Done
    target:
      entity_id: input_text.office_ledmatrix
mode: single

The Print Complete automation runs when the print state changes to ‘complete’. We set the value of the helper to ‘Done’.

alias: 3D Printer - Error
description: ''
trigger:
  - platform: state
    entity_id:
      - sensor.reprap_print_state
    to: error
condition: []
action:
  - service: input_text.set_value
    data:
      value: Error
    target:
      entity_id: input_text.office_ledmatrix
mode: single

In the rare event that we get an error, we set the helper to, well, ‘Error’.

alias: 3D Printer - Turn Off Office LED Matrix
description: ''
trigger:
  - platform: state
    entity_id:
      - sensor.reprap_print_state
    to: standby
    for:
      hours: 0
      minutes: 15
      seconds: 0
  - platform: state
    entity_id:
      - sensor.reprap_print_state
    for:
      hours: 0
      minutes: 15
      seconds: 0
    to: complete
condition: []
action:
  - service: input_text.set_value
    data:
      value: ''
    target:
      entity_id: input_text.office_ledmatrix
mode: single

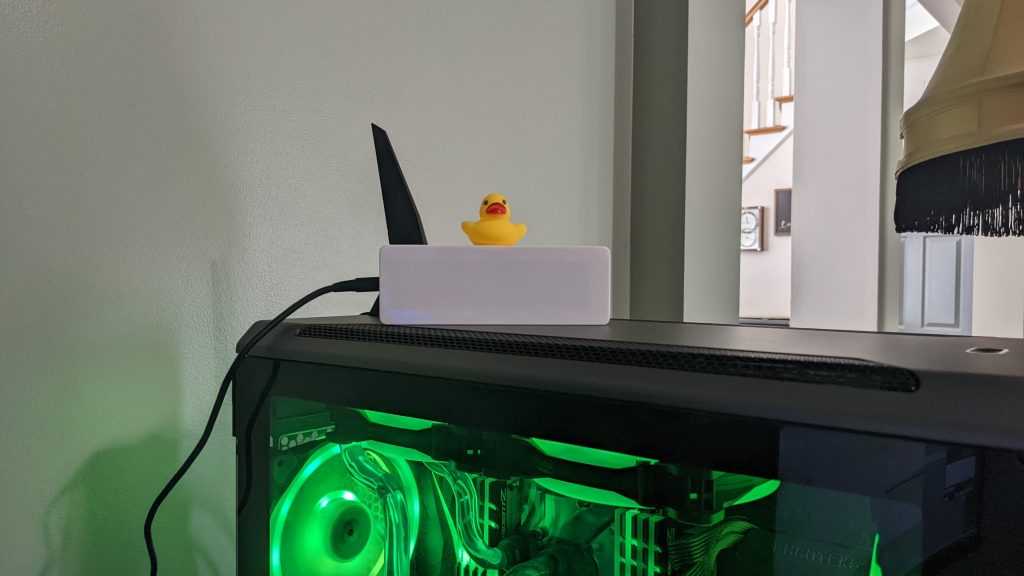
Lastly, we check if the state of the printer has been either ‘standby’ or ‘complete’ for 15 minutes or more. If so, we blank out or erase the value of our helper. This tells our ESP to turn off the screen or power off all the LEDs.

Conclusion

It’s a cheap little box that I can take anywhere in my house and just plug in to have a status display. I typically keep it in my office, but I’ve also taken it down to my woodshop while working to keep an eye on the printer from there. It took a bit to piece some of the bits of information I found together. I think I also went through 20 iterations of firmware to get the screen to a point that I was happy. Ultimately, I’ve been very happy with the little boards. I did originally purchase a different board that what I linked above, but blew two of them up due to a faulty/cheap USB cable. One word of advice, if you get one of those dinky little USB micro cables that comes with most rechargeable items… throw it away. Now that I’ve switched it over to a more robust cable, I’ve not had any issues. I plan on two more projects in the near future for this. First, I plan to get my kegerator integrated into HAss, and next, I might create a different display setup to allow for more information.

BSOD When Installing Windows Server 2022

The Problem

When attempting to boot/install Windows Server 2022, the installer crashes while booting and presents a stop code of DRIVER_IRQL_NOT_LESS_OR_EQUAL relating to storport.sys

Background

I have a set of 4 Cisco UCS C240 M3 servers that I run Hyper-V and Storage Spaces Direct on for a small Hyper-Converged cluster and some supporting infrastructure. Two of the servers serve as the HCI while the other two serve as my VMM and Backup server. Previously, I had been running Windows Server 2019 on all of the servers without any issues. I decided to run Server 2022 through it’s paces and play with some of the new features. I first re-imaged the pair of HCI servers. I created a bootable USB drive (UEFI Non-CSM) with Rufus and easily installed the OS on both servers. I then moved on to the third server, my VMM server, using the same boot drive. The booting screen appeared and before the spinning circle completed two revolutions I got a blue screen.

Troubleshooting

Wondering if something had gone awry with the hardware, I attempted to do the same with the fourth box. Same type of hardware, same result. The only difference between the two sets of boxes is the storage controllers. The HCI boxes make use of HBA controllers whereas the other two boxes make use of RAID controllers (LSI 9271CV-8i to be exact). I first took at look at the firmware. Both controllers were on the same firmware (23.33.1-0060). I downloaded and booted up the Cisco HUU ISO 3.0.4s to check if there was a newer version. Nope. I went ahead and re-flashed the firmware anyway to see if that would resolve the issue. Spoiler, it didn’t. My next thing to try was drivers. Unfortunately, this is a bit of a trickier problem as we can’t just hit F6 and pop in a floppy.

The Fix

In order to fix this issue, I needed to inject the appropriate drivers into the wims. To do this, I needed to inject the drivers into the boot.wim and install.wim from the media. Luckily, since I was using a USB drive to do the install, I could just swap out the wims on the flash drive. If you are using a CD, you’ll need to re-create the ISO using the utility of your choice.

  1. First, we need to setup a quick folder structure. I created a set of folders in C:\temp and named them Mount, Drivers, and Wims. The names aren’t important, but rather, their purpose.

2. Next, we need to mount the Server 2022 ISO and copy the install.wim and boot.wim from the sources directory of the media to the Wims folder in our temp directory. You can do it via clicking through the GUI, or via PowerShell

Mount-DiskImage <path to iso>
Copy-Item -Path D:\sources\*.wim -Destination C:\temp\Wims\
Dismount-DiskImage -DevicePath \\.\CDROM0

After copying the wims, you can dismount the ISO.

3. Since we’re going to be adding data to the wims, we need to first remove the read-only flag.

Set-ItemProperty -Path C:\temp\Wims\install.wim -Name IsReadOnly -Value $false
Set-ItemProperty -Path C:\temp\Wims\boot.wim -Name IsReadOnly -Value $false

4. Next, we’ll need to accquire our drivers. Once you’ve got all the drivers you need, copy them to the Drivers folder like so. If you have multiple drivers, it’s a good idea to store each set in it’s own folder.

5. We’ll process boot.wim first:

$indexes = 1,2
foreach ($i in $indexes) {
  Mount-WindowsImage -Path C:\temp\Mount -ImagePath C:\temp\Wims\boot.wim -Index $i
  Add-WindowsDriver -Path C:\temp\Mount -Driver C:\temp\Drivers -Recurse
  Dismount-WindowsImage -Path C:\temp\Mount -Save
}

6. Now we need to identify which editions of Windows Server we’re going to add our drivers to. If you know you’re only going to ever deploy Standard (Desktop Experience), you can opt to add the drivers to just that index.

$indexes = 1,2,3,4
foreach ($i in $indexes) {
  Mount-WindowsImage -Path C:\temp\Mount -ImagePath C:\temp\Wims\install.wim -Index $i
  Add-WindowsDriver -Path C:\temp\Mount -Driver C:\temp\Drivers -Recurse
  Dismount-WindowsImage -Path C:\temp\Mount -Save
}

7. At this point, all we need to do is copy the two wims to the sources folder on our installation media. Once we do that, we should get past the BSOD.

Installation was successful, and I now have Server 2022 running on all of the servers in my lab.

Crafting a Leather Desk Pad with Integrated PowerPlay

Recently, I’ve been looking at adding a desk pad to my desk to protect the wood. One of my requirements was that I wanted genuine leather, not the PU crap or other synthetic materials that many sellers on Amazon try to pawn off as leather. Wading through the seemingly endless list of junk, I did find quite a few listings that claimed to be real leather. The next part was trying to find one that was the size that I needed. I wanted something at least 36in (914mm) x 13in (330mm). That narrowed down the pickings, but also upped the price with most units coming in at $80 or more. I thought to myself, I can make this cheaper. So I did… Sorta.

The starting point

The Requirements

Just like any proper project, I started out forming a list of requirements. If I was going to go the custom route, it had betted damn well check all of my boxes.

  • 14in (355mm) x 40in (1016mm)
  • Top Grain or Full Grain Leather (Black or Brown)
  • Integrated PowerPlay

The Supplies

Thankfully, the supplies list for this is pretty short. I just needed some leather, some foam backing, and something to glue the two together with. For the leather, I opted for a side of chrome tanned, black stoned oil finish leather from Tandy Leather. This ran me $150. Yes, it was more expensive than buying a desk pad off of Amazon, but I can get up to 4 desk pads out of one side and still have some leftover. My side came in right at 19sqft, which makes it about $7.90/sqft. At that price, it puts the cost of my pad at $30.63. Not bad. Next was the backing. Since I was going to be putting this on top of my PowerPlay pad, I needed something under the leather to keep things level. I didn’t want a bump or indication of where the charging pad was. First step was to measure the thickness of the charging pad. According to my calipers, it came in at 2.3mm. I opted to go with some 2mm thick EVA foam. My local craft store (Michaels) had a roll of 36″x60″ for $9. Close enough. I also needed a way to adhere the two together. Looking through their glue, my options were limited for something that indicated that it bonded leather and foam. I ended up going with Gorilla Spray Adhesive for $13 as it indicated on the label that it could bond both materials.

The Build

I started by laying out the leather and making my cut lines. I used a long level and framing square to make sure I was cutting a proper rectangle as opposed to a rhombus or un-named yet to be discovered shape.

A 14″ x 36″ leather rectangle.

I used an X-Acto knife and put a cutting board beneath the leather while making the cuts. I cut from the top side of the leather to ensure that I had a nice clean edge (and it’s easier to mark). Next, I rolled out the foam and placed the leather on top to begin marking stuff out and ensure I had a decent margin.

I left myself 1/2″ on all sides of the leather and marked the position on the foam with a sharpie.
Next, I placed the charging pad to make sure it was positioned where I wanted it. I wanted it to be 1/2″ from the bottom, and 1/2″ from the right side of my pad. Above, you can see that there is more than 1/2″ because I also have a 1/2″ margin around where the edge of the leather will be.
At the top of the PowerPlay pad is the connector for the USB cable that also houses the LightSpeed dongle. This portion will protrude through the leather. I flipped the pad upside down and traced the hosing portion and cut it out.
I wanted to mask off the underside of the leather that would come into contact with the PowerPlay pad as I wanted it to sit on top of it, not be permanently bonded to it. I cut out a couple piece of paper to mask this off.
I covered a table outside with plastic and sprayed both pieces with the Gorilla Glue. There was a bit of a breeze, so I weighed down the paper mask using some quality weights.
With some help from my daughter, I laid the leather onto the foam while being careful to ensure that my cutouts lined up where they should have. I used a rubber J Roller to make sure that the leather was completely bonded to the foam.
Success. The desk is adequately covered, and the mouse charges through the leather just fine.

Conclusion

If you consider only the amount of materials that I used to make this, the build cost comes in at about $40. Not bad at all. Timewise, it was a rather light project taking about an hour to craft, most of which was planning out cuts and such before actually cutting. You may notice that there are a few wrinkles in the above photo. These will smooth out over time, and after setting a hot cup of coffee on the left side this morning, it is pretty much completely flat. I have to say, I’m pretty happy with the result.

Building a Raspberry Pi Powered Brewery Control Panel That Reports to Azure Log Analytics

The Why?

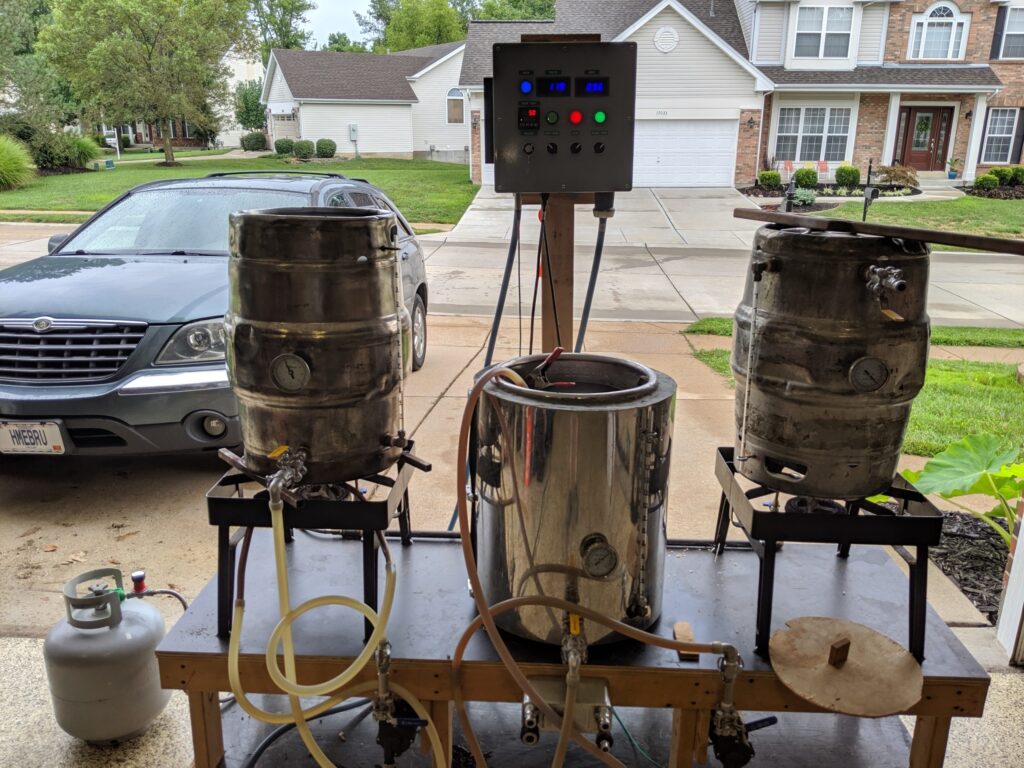
I’ve been home brewing for over 10 years. I got my start after helping a colleague brew on his system in his garage and jumped straight into an all-grain 3 vessel setup the next day. Well, not exactly the next day. It took me about a month to build my first system. I did what a lot of homebrewers do and used three 1/2 bbl kegs as brew pots with propane as the heat source. This system served me very well for those 10 years and is still fully functional today. But after 10 years of brewing in my garage, I decided it was finally time to upgrade some components, switch over to a fully electric setup, and brew in my basement where the temperature is 74℉ year round thanks to the server rack that sits in the corner. I’ve gone back and forth over the years leading up to the build as to whether or not to use a PLC of some sort, or a simple PID controlled setup. I really liked the simplicity of the PID controllers, however, the prospect of flexibility and future upgrade-ability eventually won me over and I decided to go with a Raspberry Pi powered solution. Since there are tons of articles around the net detailing how to build a panel, I’ll just touch on some of the bits without going into super detail on every aspect and instead focus on the Raspberry Pi and the code that runs everything.

My existing propane setup. Apart from adding a RIMS tube a few years ago, the setup is the same as the day I started brewing with it.

Build Objectives

For the build, there were a few things that I wanted:

  • Full stainless
  • Sanitary Fittings (Tri-Clover)
  • DIN Rail mounted components
  • 1/2 bbl (15 gal) batch size
  • Ability to run both HLT and BK at the same time

Hardware

I’ve included a full build sheet at the bottom of this article that includes places that I purchased items from and prices. The main difference between this panel, and a PID controlled one comes down to just four components:

  • Raspberry Pi
  • Touchscreen
  • Hats (expansion boards)
  • Power Supplies

For the Raspberry Pi, I went with the 4GB model 4B. I figured that the additional memory couldn’t hurt, and since everything is part of the board, the only way to upgrade down the road is to completely replace the Pi. I also opted to go with a larger touchscreen than what I used for my Fermentation Controller build. Instead of the 7″, I chose a 10″ screen to allow for an easier to read (and control) interface. We will also need a 5v and 12v power supply to power the Pi and touchscreen.

For the hats, I opted to utilise the DAQC2plate and THERMOplate from Pi-Plates. With the fermentation controller build, I simply used a DAQCplate to do both the control and temperature measurement. One key difference between the DAQCplate and THERMOplate is that the DAQCplate does the temperature readings when you ask for them (which take about a second each), as opposed to the THERMOplate which does them in the background and then just returns the last read value when you request it. For a fermentation controller, waiting one second for each temperature measurement is no big deal as we aren’t making changes rapidly or drastically. For the brewing process, we need something a bit more responsive.

Layout

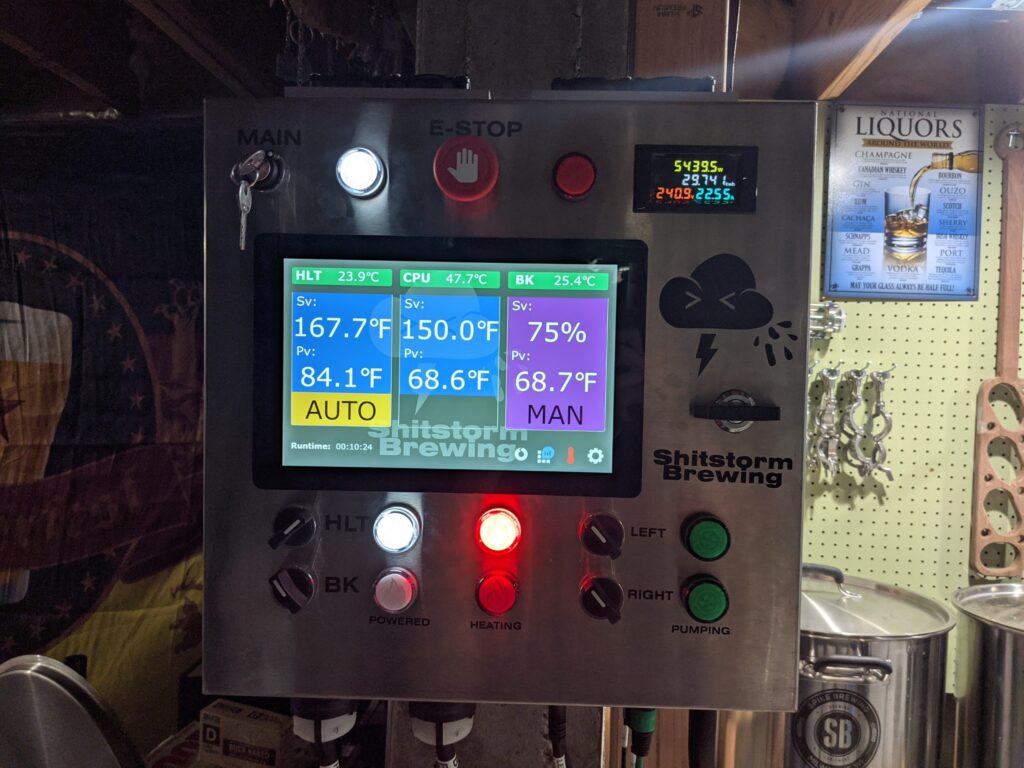
The front of the panel. Element controls on the left, pumps on the right. Master switch and E-Stop on the top row.
Inside Front
Back side of the front panel showing the switches and wires.
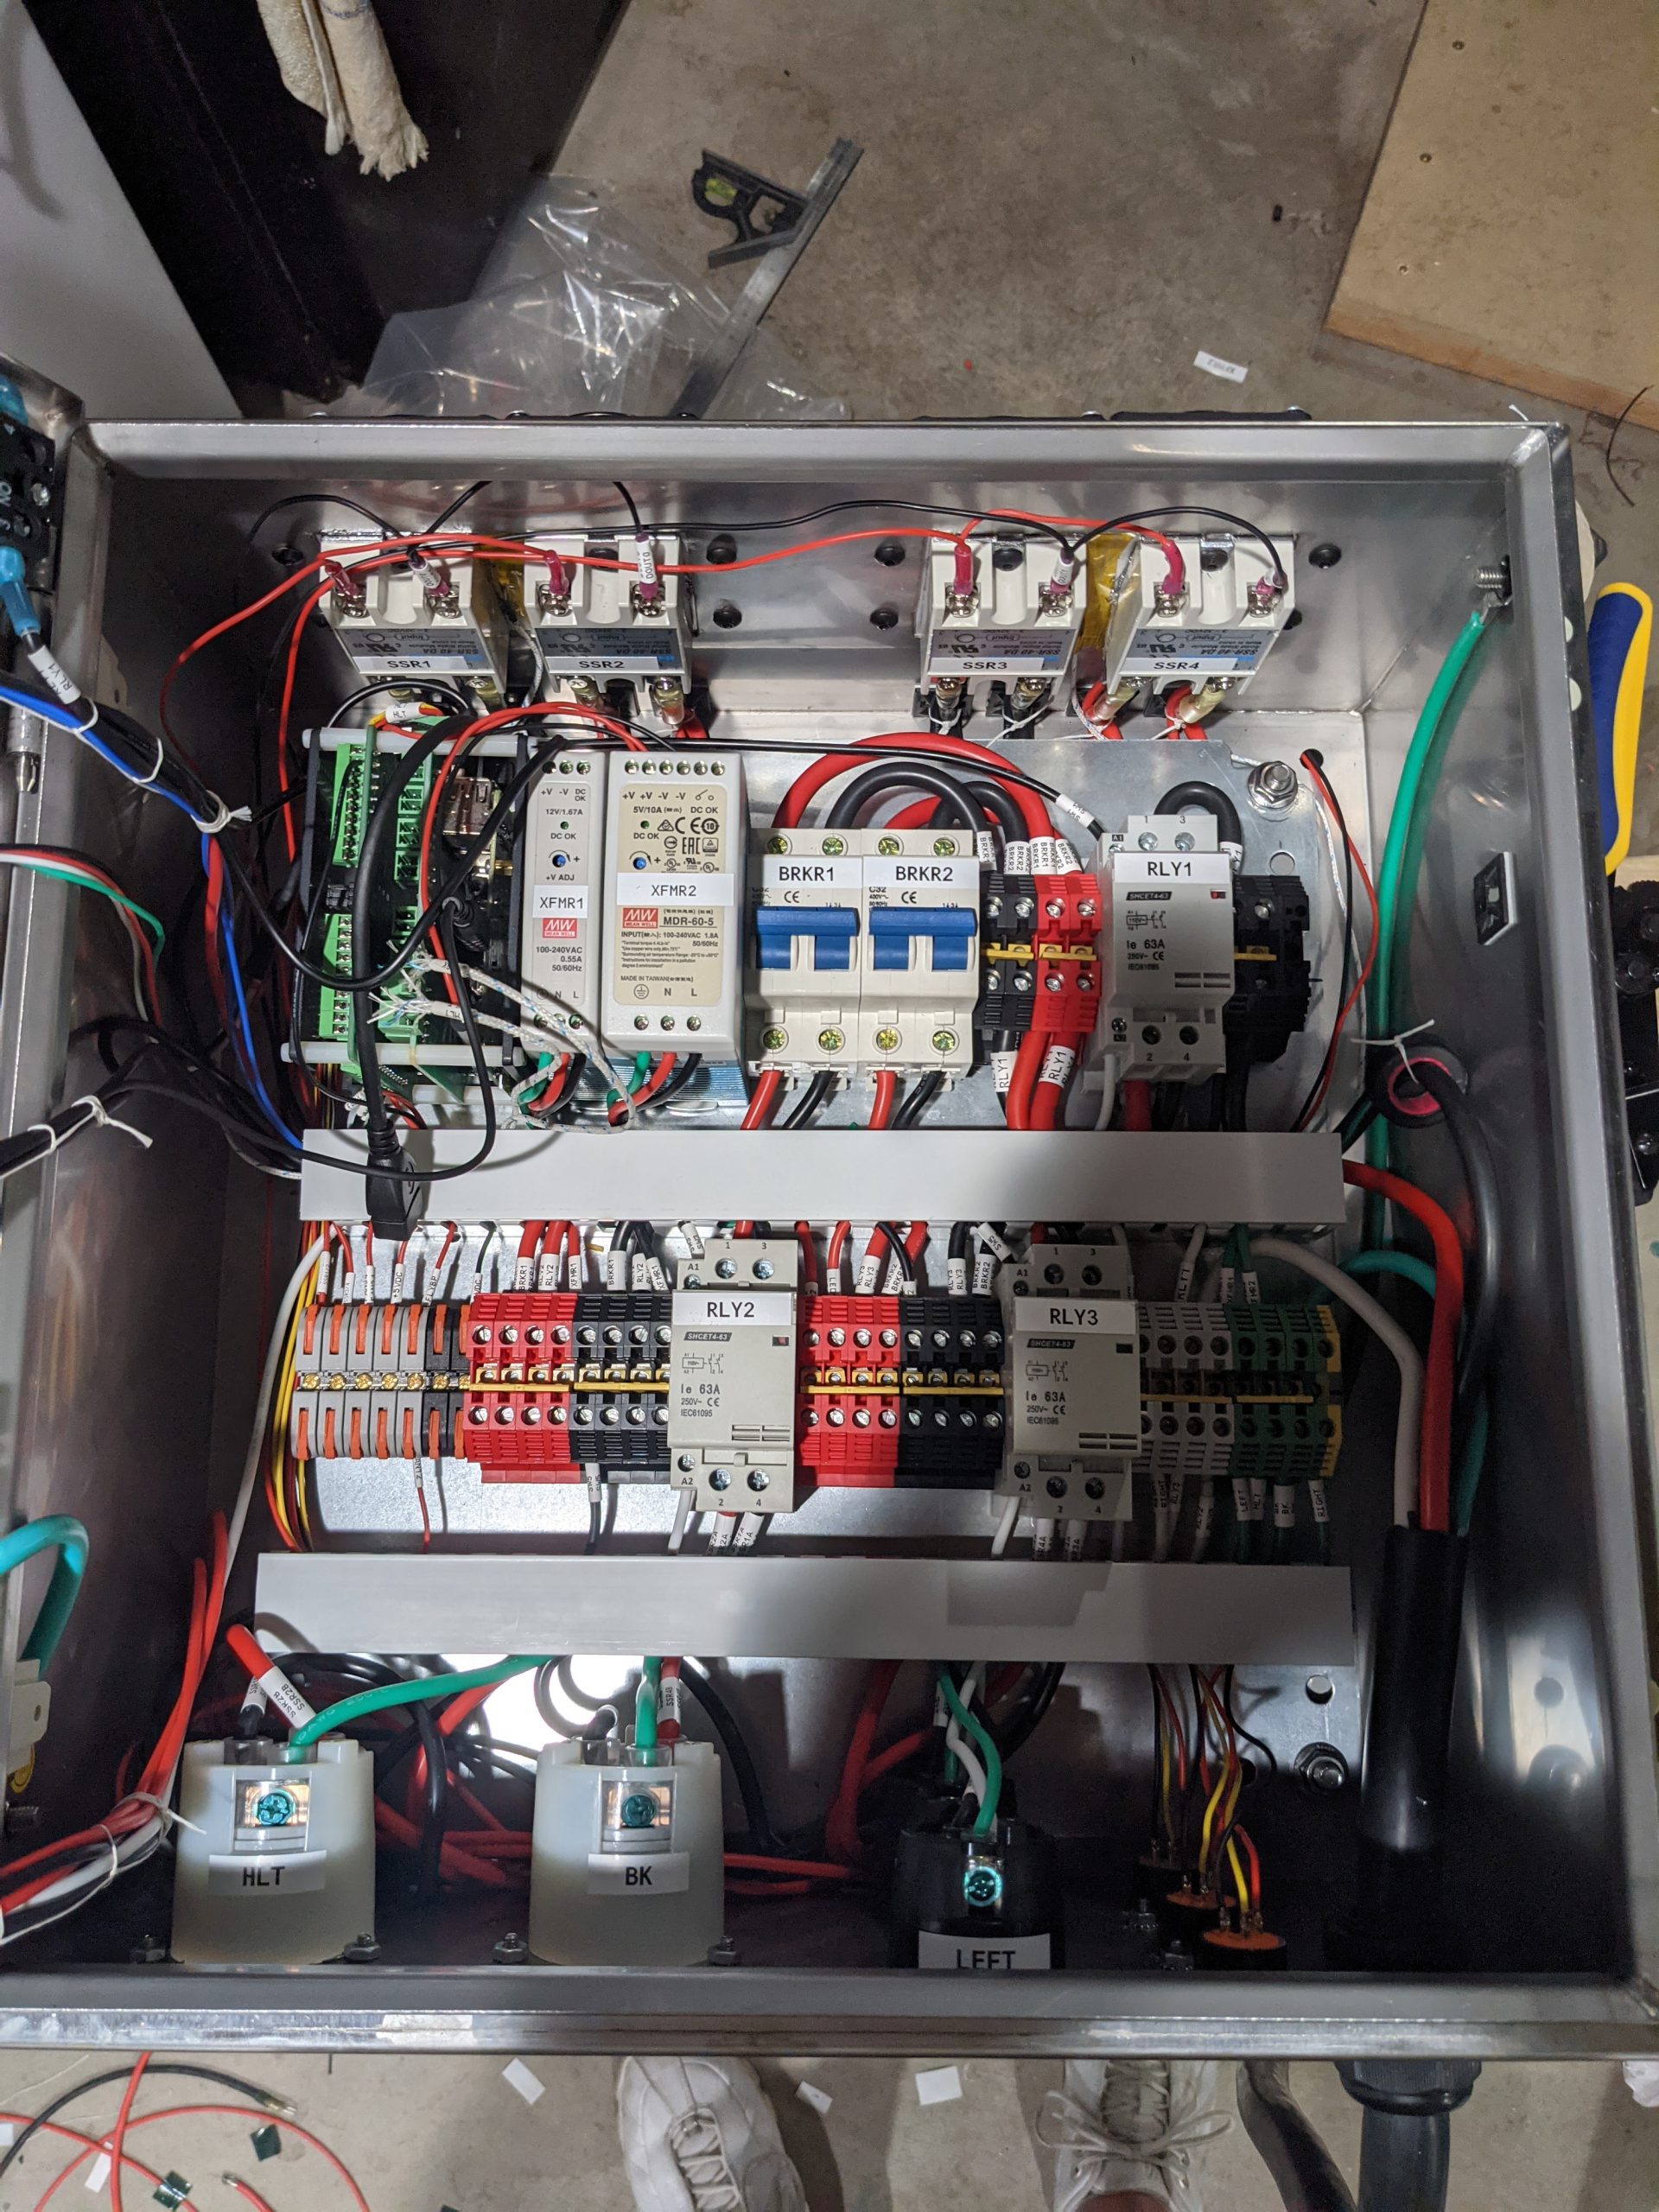
The interior of the panel

I wanted to keep the inside of my panel as tidy as possible. The DIN rails and cable raceways helped with that tremendously. The input is a 50A circuit which comes into a DPST relay (RLY1). From there, it is split to two 32A breakers (BRKR1 & 2) to ensure that a single element can’t pull more than that and to reduce down-stream wiring requirements. Each breaker feeds into a bank of terminal blocks to distribute the current to the various components on each leg. All of the 110v components (Relay coils and pumps) run off of a single breaker and phase. Two other relays (RLY2/3) are controlled via switches on the front panel to over-ride power to the heating elements. The transformers at the top power the Raspberry Pi, Pi-Plates, and Touchscreen.

Code

There are three parts to the code. The UI, the controller, and finally, the log writer. The UI is a fairly simple webpage. It makes use of css for the layout, and javascript to update the elements. PHP powers the back end to generate the responses for the AJAX calls. The controller is a python script which monitors the temperature of various components, controls the SSRs and heatsink fans, and writes metrics to a file that is used to update the UI and send data to Azure. All of the code for this is posted to my github repository.

UI

  1. Hot Liquor Tank SSR Heatsink Temperature – Monitored using a LM35DZ chip.
  2. CPU Temperature – pulled via the gpiozero python module
  3. Boil Kettle SSR Heatsink Temperature – Monitored using an LM35DZ chip.
  4. HLT Set Value – When in AUTO Mode, the controller will attempt to maintain the indicated temperature +/- the value of the Hysteresis.
  5. HLT Process Value – The value currently read from the DS18B20 probe in the HLT.
  6. Mash Tun SV – Currently, this is only used to toggle the color of the background of the MT temperature. Should I add more advanced logic or automation in the future, this can be used to control more of the process.
  7. MT PV – This is fed by another DS18B20 probe just like the HLT, only in the MT.
  8. BK SV – In this instance, the Set Value is indicated by a percentage. Instead of using temperature to control the heating element, we simply run it for a portion of the interval (in this case, 50%). The interval length can be configured to adjust the length of time the element is on or off.
  9. BK PV – Another DS18B20, only this one is in the… wait for it… Boil Kettle.
  10. HLT Mode – This can be toggled between AUTO or Temperature Mode, and MAN or Manual mode. Auto mode is controlled based on the temperature and hysteresis to determine whether the element is on or off.
  11. BK Mode – Same as #10, but for the BK.
  12. Total Runtime – How long the controller has been running (HH:mm:ss)
  13. UI Refresh – Allows the UI to be force refreshed at will.
  14. Toggles the Log Analytics Ingstion on or off.
  15. Toggles the Temperature controller on or off.
  16. Config.
  1. HLT Cycle – How many seconds between each evaluation of the temperature to determine whether or not the element should
  2. HLT Delta (Hysteresis). If the Pv is above or below the Sv by more than the Hysteresis, the element is cycled on or off.
  3. MT Delta
  4. BK Cycle Time
  5. BK Delta
  6. Shutdown System
  7. Restart System
  8. Cancel
  9. Confirm

azure.py

The azure.py script is what sends the data to Log Analytics. It consists of 4 main portions. The settings are loaded by reading the conf.json file and reading the WorkspaceId, WorkspaceKey, and LogName parameters. The WorkspaceId is the guid for the Log Analytics workspace. The Key is either the primary or secondary key. The keys and workspace ID can all be found under Agent Management (formerly advanced settings). LogName is the name of the log that will show up in Log Analytics. Like all other custom log sources, ‘_CL’ will be automatically appended to the end of whatever name you use. Our first function builds the signature to authenticate our POST requests.

def build_signature(customer_id, shared_key, date, content_length, method, content_type, resource):
    x_headers = 'x-ms-date:' + date
    string_to_hash = method + "\n" + str(content_length) + "\n" + content_type + "\n" + x_headers + "\n" + resource
    bytes_to_hash = bytes(string_to_hash).encode('utf-8')  
    decoded_key = base64.b64decode(shared_key)
    encoded_hash = base64.b64encode(hmac.new(decoded_key, bytes_to_hash, digestmod=hashlib.sha256).digest())
    authorization = "SharedKey {}:{}".format(customer_id,encoded_hash)
    return authorization

The build signature function takes a few parameters. All of the parameters are passed to it by the next function. build_signature will build a SHA256 hash based on our keys, the date and time (RFC 1123 format), and the length of the content being passed. This allows us to generate a 1-way hash that can be used by Azure to authenticate the payload once it arrives without having to pass our key.

def post_data(customer_id, shared_key, body, log_type):
    method = 'POST'
    content_type = 'application/json'
    resource = '/api/logs'
    rfc1123date = datetime.datetime.utcnow().strftime('%a, %d %b %Y %H:%M:%S GMT')
    content_length = len(body)
    signature = build_signature(customer_id, shared_key, rfc1123date, content_length, method, content_type, resource)
    uri = 'https://' + customer_id + '.ods.opinsights.azure.com' + resource + '?api-version=2016-04-01'
    headers = {
        'content-type': content_type,
        'Authorization': signature,
        'Log-Type': log_type,
        'x-ms-date': rfc1123date
    }
    response = requests.post(uri,data=body, headers=headers)

post_data is the function that we interact with directly to send the information to Azure. It will call build_signature and form the payload. It takes our Workspace ID, Workspace Key, Body (JSON formated string), and name of the log. Since we store our data or payload in JSON format, we don’t have to do much else other than read the json file and pass it along.

def OnKill(signum, frame):
    global run
    run = False
signal.signal(signal.SIGINT, OnKill)
signal.signal(signal.SIGTERM, OnKill)

This is our exit handler. Since the script runs in the background and we don’t directly interact with it, we need a way to tell it to exit and what to do when we tell it to do so. We use the signal library to handle these. First we define our function that gets called (OnKill) and then we register handlers to call it depending on which type of signal was sent to the application. The first registers it to handle “INT” signals. In our case, this would be like hitting Ctrl+C from an SSH terminal to kill the running application or using kill -2 <pid>. The second intercepts “TERM” signals or kill -15 <pid>. If either of these signals is sent to our program, tell our program to set the run variable to false which causes our loop in the next code block to stop looping.

while run:
    try:
        #Read Current Data Points
        f = open('/var/www/html/py/data.json', 'r')
        data = json.load(f)
        f.close()
        body = json.dumps(data)
        post_data(customer_id, shared_key, body, log_type)
    except Exception as e:
        now = datetime.datetime.now()
        print(e)
        f = open('/var/www/html/python_errors.log', 'a')
        f.write("%s - AZURE [%i] - %s\n" % (now.strftime("%Y-%m-%d %H:%M:%S"), sys.exc_info()[-1].tb_lineno, e))
        f.close()
    time.sleep(LoopDelay)

This loop will continue to run as long as run is set to True. If we receive one of the signals mentioned earlier (SIGINT or SIGTERM) we set run to False and kill the loop. The loop is simple. It pulls the latest data from the data.json file and passes it as the payload to Log Analytics using the REST API. Our data.json file looks like this:

{
    "MtAuto": 152,
    "HltAuto": 130,
    "BkStatus": 0,
    "BkMode": "M",
    "HltStatus": 1,
    "HltHsTemp": 25.93,
    "BkAuto": 8.7,
    "MtTemp": 66.65,
    "HltDelta": 1,
    "BkTemp": 66.988,
    "MtDelta": 1,
    "HltMan": 50,
    "BkMan": 50,
    "CpuTemp": 46.738,
    "BkHsTemp": 25.88,
    "HltCycle": 3,
    "BkCycle": 5,
    "HltTemp": 66.313,
    "HltMode": "A",
    "BkDelta": 1
}

This is the data that we pass to Log Analytics which can then be queried. In the below example, we pull a count of all entries where the measured HLT Temp was higher than the set point + delta and bin it in 5 minute intervals. These would be periods where we overshoot our temps.

BrewController_CL
| where HltTemp > (HltAuto + HltDelta)
| summarize count() by bin(TimeGenerated, 5m)

If you’re thinking to yourself that the azure code looks familiar, yes, it probably does. It’s the code that’s available on the Azure Monitor Data Collector API page. I’m using the python 2 version of the code.

tempcontrol.py

The temp control script is where most of the magic happens. This is where we read our sensor data, act on it (if needed) and write the data to a file for the UI or Azure script to ingest and process.

 while run:
        currTime = round(time.time(), 1)
        #Update existing values
        if UpdateTemps:
            #Load Data
            f = open('/var/www/html/py/data.json', 'r')
            data = json.load(f)
            f.close()
            #Update Data
            data['HltHsTemp'] = GetHeatsink(0)
            data['CpuTemp'] = GetCPU()
            data['BkHsTemp'] = GetHeatsink(1)
            data['HltTemp'] = THERMO.getTEMP(0,11)
            data['MtTemp'] = THERMO.getTEMP(0,10)
            data['BkTemp'] = THERMO.getTEMP(0,9)
            UpdateTemps = False
            #Update Uptime File
            f = open('/var/www/html/py/uptime', 'w')
            f.write(str(currTime - startTime))
            f.close()
            #Check for Updated Targets
                #Mode
            if os.path.exists('/var/www/html/py/mode.json'):
                f = open('/var/www/html/py/mode.json', 'r')
                NewData = json.load(f)
                f.close()
                if NewData['Target'] == 'hlt':
                    data['HltMode'] = NewData['NewMode']
                elif NewData['Target'] == 'bk':
                    data['BkMode'] = NewData['NewMode']
                os.remove('/var/www/html/py/mode.json')
                #Temp
            if os.path.exists('/var/www/html/py/temp.json'):
                f = open('/var/www/html/py/temp.json', 'r')
                NewData = json.load(f)
                f.close()
                if NewData['Target'] == 'hlt' and NewData['Mode'] == 'a':
                    data['HltAuto'] = NewData['Value']
                elif NewData['Target'] == 'hlt' and NewData['Mode'] == 'm':
                    data['HltMan'] = NewData['Value']
                elif NewData['Target'] == 'mt' and NewData['Mode'] == 'a':
                    data['MtAuto'] = NewData['Value']
                elif NewData['Target'] == 'bk' and NewData['Mode'] == 'a':
                    data['BkAuto'] = NewData['Value']
                elif NewData['Target'] == 'bk' and NewData['Mode'] == 'm':
                    data['BkMan'] = NewData['Value']
                os.remove('/var/www/html/py/temp.json')
                #Settings
            if os.path.exists('/var/www/html/py/settings.json'):
                f = open('/var/www/html/py/settings.json', 'r')
                NewData = json.load(f)
                f.close()
                data['HltCycle'] = NewData['HltCycle']
                data['HltDelta'] = NewData['HltDelta']
                data['MtDelta'] = NewData['MtDelta']
                data['BkCycle'] = NewData['BkCycle']
                data['BkDelta'] = NewData['BkDelta']
                os.remove('/var/www/html/py/settings.json')
        else:
            UpdateTemps = True
        #HLTControl
        if data['HltMode'] == 'A':
            HLTOn = ActionCount + 1
            if data['HltTemp'] < (data['HltAuto'] - data['HltDelta']):
                TurnHLTOn()
            else:
                TurnHLTOff()
        else:
            if HLTOn == ActionCount:
                TurnHLTOn()
                HltCycleLen = data['HltCycle'] * 2
                HLTOn = ActionCount + HltCycleLen
                HLTOff = ActionCount + ((float(data['HltMan']) / 100) * HltCycleLen)
            if HLTOff == ActionCount:
                TurnHLTOff()
            elif HLTOn < ActionCount and HLTOff < ActionCount:
                HLTOn = ActionCount + 1
        
        #BKControl
        if data['BkMode'] == 'A':
            BKOn = ActionCount + 1
            if data['BkTemp'] < (data['BkAuto'] - data['BkDelta']):
                TurnBKOn()
            else:
                TurnBKOff()
        else:
            if BKOn == ActionCount:
                TurnBKOn()
                BkCycleLen = data['BkCycle'] * 2
                BKOn = ActionCount + BkCycleLen
                BKOff = ActionCount + ((float(data['BkMan']) / 100) * BkCycleLen)
            if BKOff == ActionCount:
                TurnBKOff()
            elif BKOn < ActionCount and BKOff < ActionCount:
                BKOn = ActionCount + 1
        ActionCount += 1
        #Save Data
        f = open('/var/www/html/py/data.json', 'w')
        json.dump(data, f)
        f.close()
        #Sleep
        time.sleep(0.5)
except Exception as e:
    now = datetime.now()
    print(e)
    f = open('/var/www/html/python_errors.log', 'a')
    f.write("%s - TEMP CONTROL [%i] - %s\n" % (now.strftime("%Y-%m-%d %H:%M:%S"), sys.exc_info()[-1].tb_lineno, e))
    f.close()

We start with reading the temp probe data starting on line 5. Since our DS18B20 probes only update once per second, and our loop runs every 1/2 second, there is no need to update them every loop. We use a simple bool flag to run this portion of code every other loop. Next, we check our HLT and BK to determine whether to cycle them on, off, or do nothing. If we’re in automatic mode, we check the current temp (Pv) and compare it against the target temp (Sv) and hysteresis (Delta). If Pv < (Sv – Delta) then we turn the element on. If not, we turn it off. On a true PID controller, the element might remain on longer in order to stabilise the temperature and reduce the variance. So far, I’ve found that I haven’t needed the more advanced logic of a true PID controller to keep my temps where I need them, so I’ve opted to keep things simple. I may end up switching it to PID logic should I find that not the case, but the first couple batches that I’ve done on the system have been really good. If the elements are in manual mode, we take a look at the cycle length, compare it to on percentage and calculate the number of loops the element should be on and off. We then set each into a variable that tells it when to turn on.

Azure Monitor Workbook

So, we’re brewing beer and putting data into Azure. How do we use that data? I have a TV in my brew area that I pull the workbook up on on brew day. This allows me to monitor data and trends and make adjustments whether it be for that brew session, or the next one.

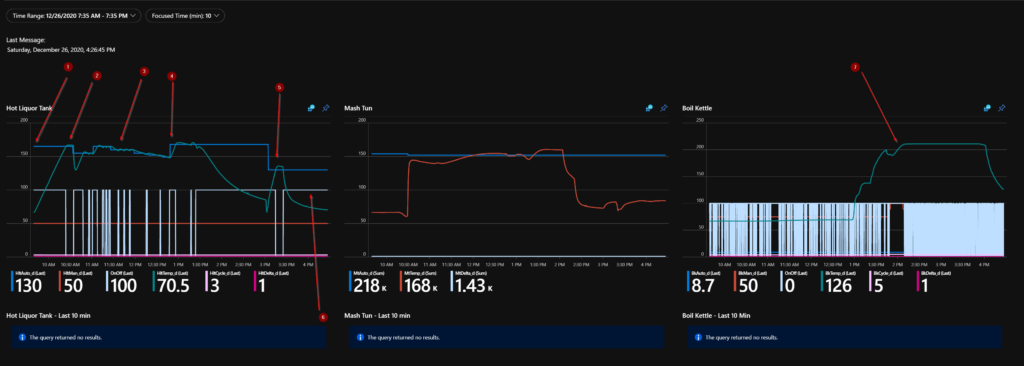
Our Brewery Controller workbook

What does this mean?

I’ve marked a few points on the image above which show some interesting points in our brew day.

  1. You can see the blue line on the HLT graph set to our strike temperature which was 165℉ for this recipe. You can also see the greenish line that indicates that actual temperature of the water. For this, I was heating around 18 Gal of water from room temp (about 68℉) to our strike temperature.
  2. At point 2, we hit our strike temp and can perform our mash in. You’ll notice that a few minutes after we hit temp, it plumets to around 130℉ and then starts to rise again. After I mashed in, I added another 5 Gal of water to the HLT to ensure I had enough for mash out/sparge. Since the water I added was also at room temp, it dropped the temperature of the HLT down which then gets heated back up. You’ll also notice that I reduced the set point of the HLT at this time. I make use of a HERMS coil to maintain mash temperatures, so once mashing in is taken care of, I set the temperature of my HLT to whatever temperature I want my mash to be and then re-circulate it through the HERMS (pictures below).
  3. The area around point 3 is where I ran into a problem. Some of the rice hulls that I was using as a filter bed got sucked into the hoses. It took me a while to figure out what was going on. The sprayer that I was using to evenly distribute water across the top of the grain bed got clogged by the rice hulls. Water was still coming out, but it wasn’t re-circulating enough water to affect the mash temperature. I swapped out the end of my re-circulation sprayer with a different style which included a larger opening. Once in place, temperatures were back where I wanted them.
  4. Number 4 is where I performed my mash out. I raised to the HLT temp to 168℉ to halt conversion and began sparging. The point where the temperature starts to drop is the point that I shut the element override off from the switch on the control panel. The controller doesn’t see this which is why we have a divergence from the set value and process value.
  5. Point 5 is where I added and heated up some additional water to use for cleaning.
  6. Point 6 calls out the light blue lines. These are used to indicate when the element is “on” as far as the controller is concerned. On the HLT it’s pretty easy to see the periods where the element is on and off. On the BK, it’s a bit more condensed since it’s in manual mode and automatically firing quite rapidly. I have found so far that with a 5 second cycle length and the element on 50%, I can maintain a nice boil without boiling over.
  7. You’ll notice at Point 7, there is a sharp hook, a dip, and then a climb before it levels off. Before this point, I had my element set to something like 75% or 80%. This was a bit too aggressive and caused a near boil-over. The spike is the point where I turned the BK override off, made some adjustments, and turned it back on.

Dashboard Template

{
  "version": "Notebook/1.0",
  "items": [
    {
      "type": 9,
      "content": {
        "version": "KqlParameterItem/1.0",
        "parameters": [
          {
            "id": "ee40ef7f-bcea-4d1c-a3da-fca1355319cd",
            "version": "KqlParameterItem/1.0",
            "name": "TimeRange",
            "label": "Time Range",
            "type": 4,
            "isRequired": true,
            "value": {
              "durationMs": 43200000,
              "endTime": "2020-12-27T01:35:00.000Z"
            },
            "typeSettings": {
              "selectableValues": [
                {
                  "durationMs": 300000
                },
                {
                  "durationMs": 900000
                },
                {
                  "durationMs": 1800000
                },
                {
                  "durationMs": 3600000
                },
                {
                  "durationMs": 14400000
                },
                {
                  "durationMs": 43200000
                },
                {
                  "durationMs": 86400000
                }
              ],
              "allowCustom": true
            },
            "timeContext": {
              "durationMs": 86400000
            }
          },
          {
            "id": "9c69ebb2-0553-43b3-9662-162cd0a650b0",
            "version": "KqlParameterItem/1.0",
            "name": "FocusTime",
            "label": "Focused Time (min)",
            "type": 1,
            "isRequired": true,
            "value": "10",
            "typeSettings": {
              "paramValidationRules": [
                {
                  "regExp": "[\\d]*",
                  "match": true,
                  "message": "Must be a Number"
                }
              ]
            },
            "timeContext": {
              "durationMs": 86400000
            }
          }
        ],
        "style": "pills",
        "queryType": 0,
        "resourceType": "microsoft.operationalinsights/workspaces"
      },
      "name": "parameters - 5"
    },
    {
      "type": 3,
      "content": {
        "version": "KqlItem/1.0",
        "query": "BrewDay_CL\r\n| top 1 by TimeGenerated\r\n| extend Title = \"Last Message:\"\r\n| project TimeGenerated, Title",
        "size": 4,
        "timeContext": {
          "durationMs": 43200000,
          "endTime": "2020-12-27T01:35:00.000Z"
        },
        "timeContextFromParameter": "TimeRange",
        "queryType": 0,
        "resourceType": "microsoft.operationalinsights/workspaces",
        "visualization": "tiles",
        "tileSettings": {
          "titleContent": {
            "columnMatch": "Title"
          },
          "leftContent": {
            "columnMatch": "TimeGenerated",
            "formatter": 6
          },
          "showBorder": false,
          "size": "full"
        }
      },
      "name": "query - 4"
    },
    {
      "type": 3,
      "content": {
        "version": "KqlItem/1.0",
        "query": "BrewDay_CL\r\n| project TimeGenerated, HltAuto_d, HltMan_d, OnOff = HltStatus_d * 100, HltTemp_d, HltCycle_d, HltDelta_d",
        "size": 0,
        "aggregation": 5,
        "showAnalytics": true,
        "title": "Hot Liquor Tank",
        "timeContext": {
          "durationMs": 43200000,
          "endTime": "2020-12-27T01:35:00.000Z"
        },
        "timeContextFromParameter": "TimeRange",
        "queryType": 0,
        "resourceType": "microsoft.operationalinsights/workspaces",
        "visualization": "linechart"
      },
      "customWidth": "33",
      "showPin": true,
      "name": "HltOverall"
    },
    {
      "type": 3,
      "content": {
        "version": "KqlItem/1.0",
        "query": "BrewDay_CL\r\n| where (TimeGenerated > {TimeRange:start}) and (TimeGenerated < {TimeRange:end})\r\n| project TimeGenerated, MtAuto_d, MtTemp_d, MtDelta_d",
        "size": 0,
        "showAnalytics": true,
        "title": "Mash Tun",
        "timeContext": {
          "durationMs": 43200000,
          "endTime": "2020-12-27T01:35:00.000Z"
        },
        "timeContextFromParameter": "TimeRange",
        "queryType": 0,
        "resourceType": "microsoft.operationalinsights/workspaces",
        "visualization": "linechart"
      },
      "customWidth": "33",
      "showPin": true,
      "name": "MtOverall"
    },
    {
      "type": 3,
      "content": {
        "version": "KqlItem/1.0",
        "query": "BrewDay_CL\r\n| project TimeGenerated, BkAuto_d, BkMan_d, OnOff = BkStatus_d * 100, BkTemp_d, BkCycle_d, BkDelta_d",
        "size": 0,
        "aggregation": 5,
        "showAnalytics": true,
        "title": "Boil Kettle",
        "timeContext": {
          "durationMs": 43200000,
          "endTime": "2020-12-27T01:35:00.000Z"
        },
        "timeContextFromParameter": "TimeRange",
        "queryType": 0,
        "resourceType": "microsoft.operationalinsights/workspaces",
        "visualization": "linechart"
      },
      "customWidth": "33",
      "showPin": true,
      "name": "BkOverall"
    },
    {
      "type": 3,
      "content": {
        "version": "KqlItem/1.0",
        "query": "BrewDay_CL\r\n| where TimeGenerated > ago({FocusTime:value}m)\r\n| project TimeGenerated, HltAuto_d, HltMan_d, OnOff = HltStatus_d * 100, HltTemp_d, HltCycle_d, HltDelta_d",
        "size": 0,
        "title": "Hot Liquor Tank - Last {FocusTime:value} min",
        "queryType": 0,
        "resourceType": "microsoft.operationalinsights/workspaces",
        "visualization": "linechart"
      },
      "customWidth": "33",
      "name": "HltFocused"
    },
    {
      "type": 3,
      "content": {
        "version": "KqlItem/1.0",
        "query": "BrewDay_CL\r\n| where TimeGenerated > ago({FocusTime:value}m)\r\n| project TimeGenerated, MtAuto_d, MtTemp_d, MtDelta_d",
        "size": 0,
        "title": "Mash Tun - Last {FocusTime:value} min",
        "queryType": 0,
        "resourceType": "microsoft.operationalinsights/workspaces",
        "visualization": "linechart"
      },
      "customWidth": "33",
      "name": "MtFocused"
    },
    {
      "type": 3,
      "content": {
        "version": "KqlItem/1.0",
        "query": "BrewDay_CL\r\n| where TimeGenerated > ago({FocusTime:value}m)\r\n| project TimeGenerated, BkAuto_d, BkMan_d, OnOff = BkStatus_d * 100, BkTemp_d, BkCycle_d, BkDelta_d",
        "size": 0,
        "title": "Boil Kettle - Last {FocusTime:value} Min",
        "queryType": 0,
        "resourceType": "microsoft.operationalinsights/workspaces",
        "visualization": "linechart"
      },
      "customWidth": "33",
      "name": "BkLastFive"
    },
    {
      "type": 3,
      "content": {
        "version": "KqlItem/1.0",
        "query": "BrewDay_CL\r\n| project TimeGenerated, Target=HltAuto_d, Temperature=HltTemp_d, Manual=HltMan_d",
        "size": 0,
        "aggregation": 5,
        "showAnalytics": true,
        "title": "Hot Liquor Tank",
        "timeContext": {
          "durationMs": 172800000
        },
        "queryType": 0,
        "resourceType": "microsoft.operationalinsights/workspaces",
        "visualization": "linechart",
        "chartSettings": {
          "seriesLabelSettings": [
            {
              "seriesName": "Target",
              "color": "blue"
            },
            {
              "seriesName": "Temperature",
              "color": "turquoise"
            },
            {
              "seriesName": "Manual",
              "color": "greenDark"
            }
          ]
        }
      },
      "showPin": true,
      "name": "query - 8"
    },
    {
      "type": 3,
      "content": {
        "version": "KqlItem/1.0",
        "query": "BrewDay_CL\r\n| project TimeGenerated, Target=MtAuto_d, Temperature=MtTemp_d",
        "size": 0,
        "aggregation": 5,
        "showAnalytics": true,
        "title": "Mash Tun",
        "timeContext": {
          "durationMs": 172800000
        },
        "queryType": 0,
        "resourceType": "microsoft.operationalinsights/workspaces",
        "visualization": "linechart",
        "chartSettings": {
          "seriesLabelSettings": [
            {
              "seriesName": "Target",
              "color": "redBright"
            },
            {
              "seriesName": "Temperature",
              "color": "yellow"
            }
          ]
        }
      },
      "showPin": true,
      "name": "query - 9"
    },
    {
      "type": 3,
      "content": {
        "version": "KqlItem/1.0",
        "query": "BrewDay_CL\r\n| project TimeGenerated, Target = BkAuto_d, Temperature = BkTemp_d, Manual = BkMan_d",
        "size": 0,
        "aggregation": 5,
        "showAnalytics": true,
        "title": "Boil Kettle",
        "timeContext": {
          "durationMs": 172800000
        },
        "queryType": 0,
        "resourceType": "microsoft.operationalinsights/workspaces",
        "visualization": "linechart",
        "chartSettings": {
          "seriesLabelSettings": [
            {
              "seriesName": "Target",
              "color": "purple"
            },
            {
              "seriesName": "Temperature",
              "color": "green"
            },
            {
              "seriesName": "Manual",
              "color": "blue"
            }
          ]
        }
      },
      "showPin": true,
      "name": "query - 10"
    }
  ],
  "fallbackResourceIds": [
    "/subscriptions/<SUBSCRIPTIONID>/resourcegroups/<RESOURCEGROUP>/providers/Microsoft.OperationalInsights/workspaces/<WORKSPACENAME>"
  ],
  "$schema": "https://github.com/Microsoft/Application-Insights-Workbooks/blob/master/schema/workbook.json"
}

You’ll need to replace <SUBSCRIPTIONID>, <RESOURCEGROUP>, and <WORKSPACENAME> with appropriate values should you want to utilize this in your environment. From a data standpoint, I’ve found that a single brew day uses less than 200KB of quota. Even if you brew every day, you’ll likely never exceed the 5GB of free usage to incur a charge (based on current pricing plans as of 2021-01-01).

Brewery Pictures

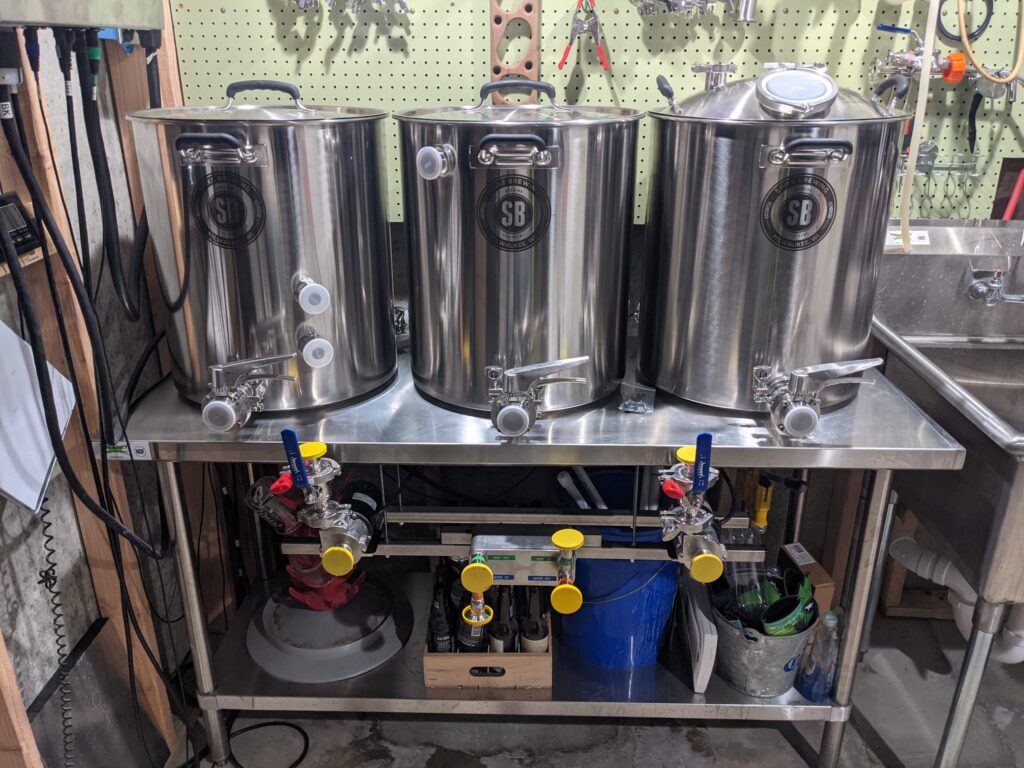
This is the finished result. From left to right, HLT, MT, BK. Two pumps (March 809’s with Center Inlet TC Conversion heads from brewershardware.com and the plate chiller from my old setup with the connection fittings swapped to TC. For the pumps, I found that I was able to remove the nuts that hold the top of the table on, and use couplers and some stainless M6 threaded rod to create a “shelf” for the pumps to attach to. This allowed me to attach the pumps and chiller without drilling into or permanently altering the table.
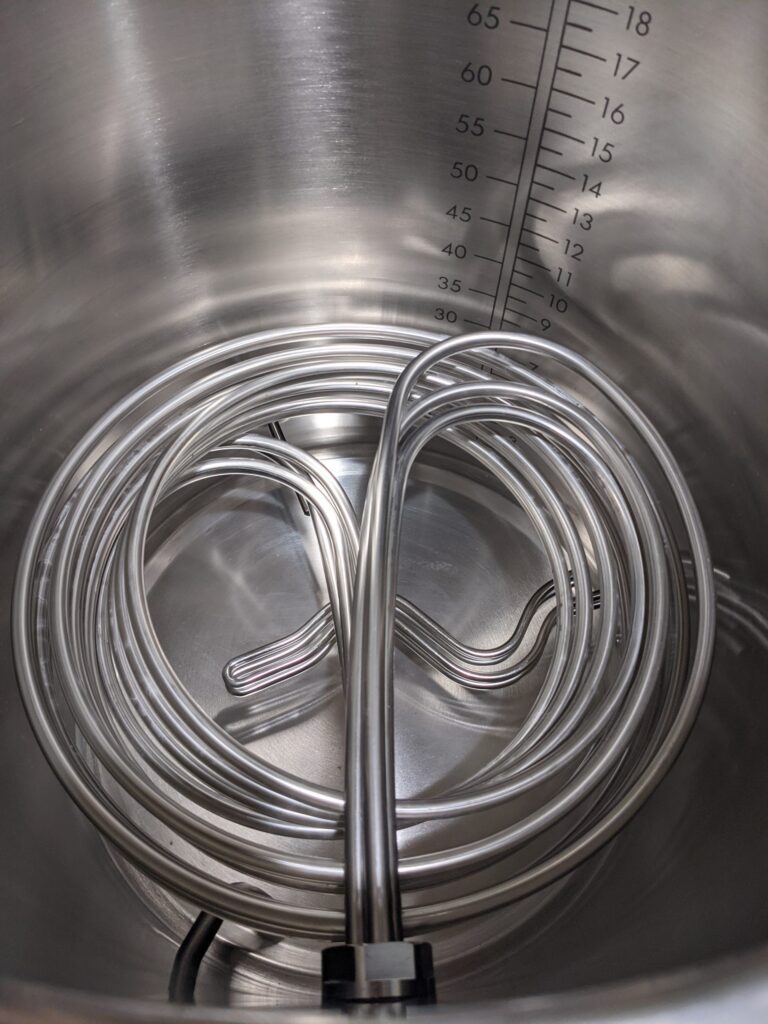
This is the inside of my HLT. You can see the stainless wavy element below the HERMS coil. I ended up going with a 3 coil parallel one from brewpi. This reduces the height of the coil while keeping the surface area of a larger coil. The reduced height allows me to keep it submerged with substantially less water.
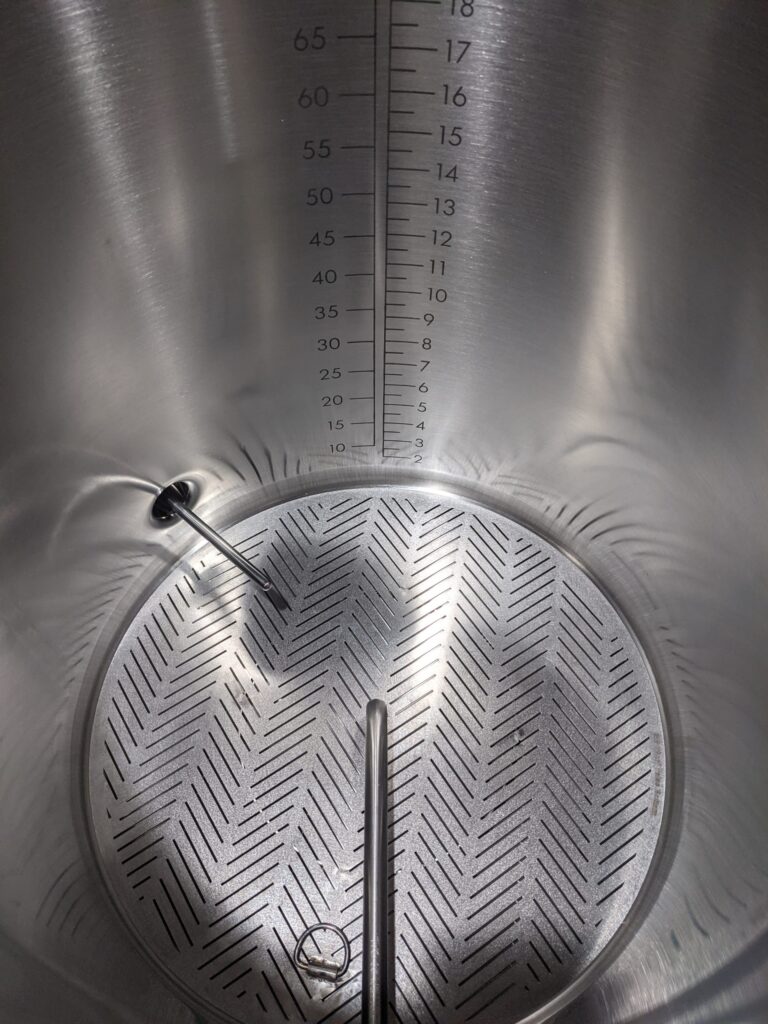
The inside of the Mash Tun. False bottom on the…. bottom.
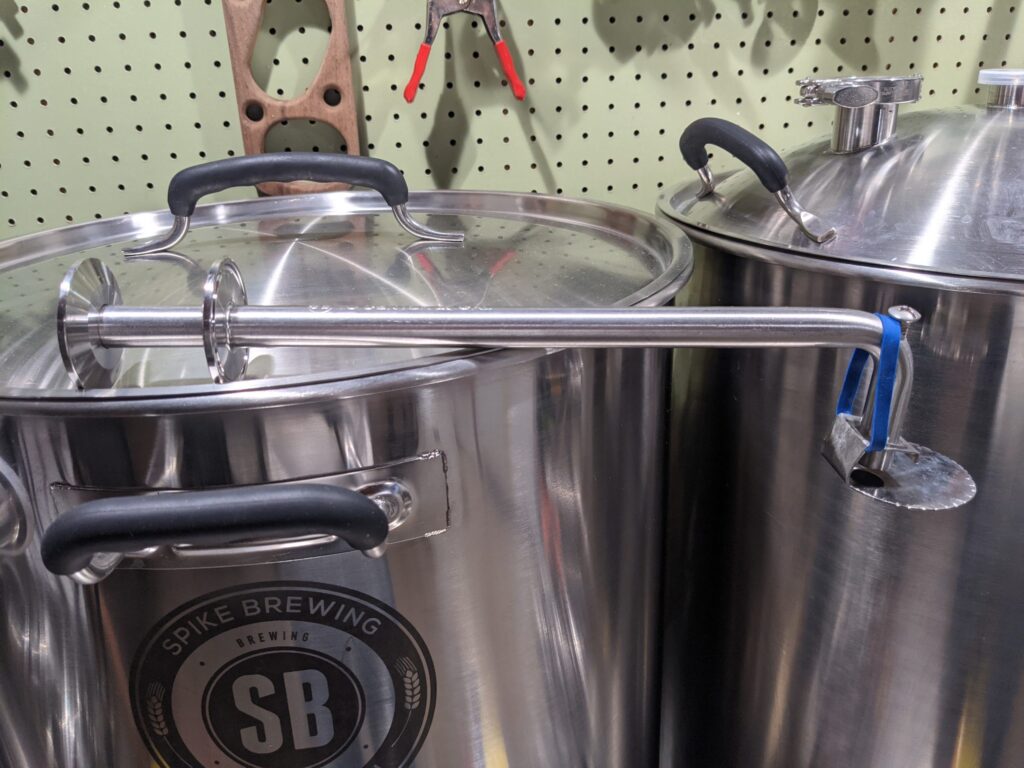
This is what I’ve devised for a sparge arm/recirc arm. It’s a center pickup from Spike that I took a bit of the stainless that I cut from the control panel and fashioned a little flapper thing to spread the water over the top. The rubber band currently holds the flapper on. I may try to use some sort of a screw or something in the side to hold it up, but my machining capabilities for metal are a bit limited.

Build Costs & Parts List

The total cost of the build wasn’t actually as bad as I thought it might have been. The panel ended up a just over $1,600 and the brewery itself was just over $4,100. Those prices do not include shipping, but for most items, shipping was free. I would add probably another $100 to the overall total for shipping from places that it wasn’t free. The build sheet can be found on my OneDrive. There are two separate tabs; one for the panel, and one for the brewery. On the brewery side of things, there were many pieces of equipment that I already had from my last brewery, so this is not a comprehensive list for everything you need if you have nothing (things like hydrometers, scales, grain mill, etc). All of the source code is on my GitHub.

Thanks

I’d like to give a special thanks to a few people.

  • Mike Cymerman from Spike Brewing who helped with the design and port locations for the custom kettles.
  • Jerry Wasinger from Pi-Plates who helped troubleshoot some of the initial issues I ran into getting the code working for the THERMOplate.
  • Matt Dunlop for drinking with me and keeping me company on my first brew day with the new system and telling me it was cool.

Using an App Registration to Query Log Analytics via Power BI

Power BI is a great tool to visualize data and create effective interactive dashboards and reports. Log Analytics is great to gather and correlate data. Naturally, the two are a great pair. While there isn’t yet a native connector for Log Analytics, you can still pull data by writing a custom M Query in Power BI. Thankfully, with just a couple clicks from Log Analytics, it will generate everything for you so that you don’t need to know M Query to pull data. When doing this, you’ll need to login to Azure using an Organization Account or another interactive login method. But what if you need to have a report that doesn’t require you to login every time? Using an App Registration and authenticating via OAuth can accomplish this, but how do we do that in PowerBI?

Security Disclaimer

The method that I’m going to show you stores the API Key in the dataset/query. This is meant as more of a PoC than something that you would use in any sort of a production environment unless you can protect that data. If you’re putting this report on a PowerBI server, you’ll want to make sure people cannot download a copy of the report file as that would allow them to obtain the API key.

Setup

Before we try to query Log Analytics from Power BI with OAuth, we need to setup an App Registration.

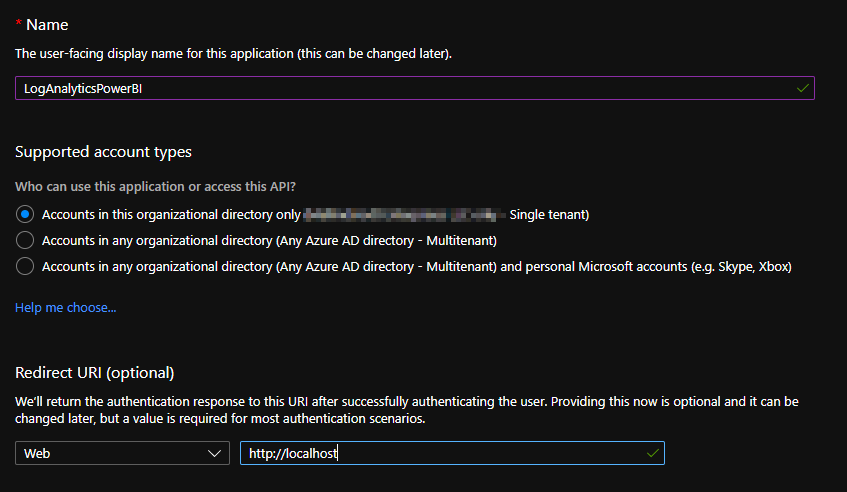
  1. Log into Azure and open App Registrations either from the main portal or via Azure Active Directory. Click on the New Registration button, give it a name and a Redirect URI.

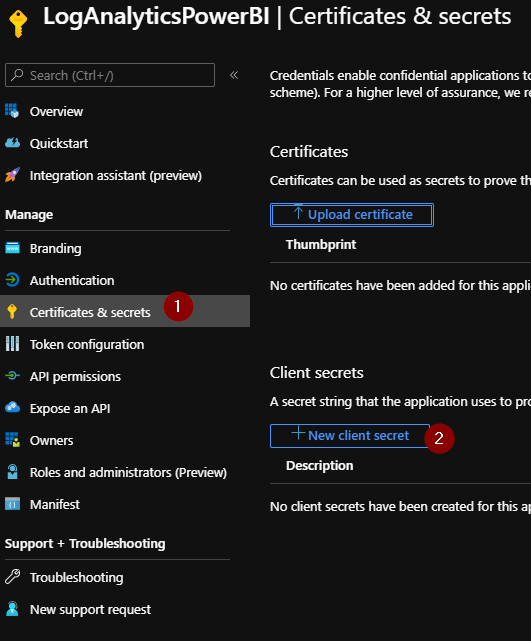
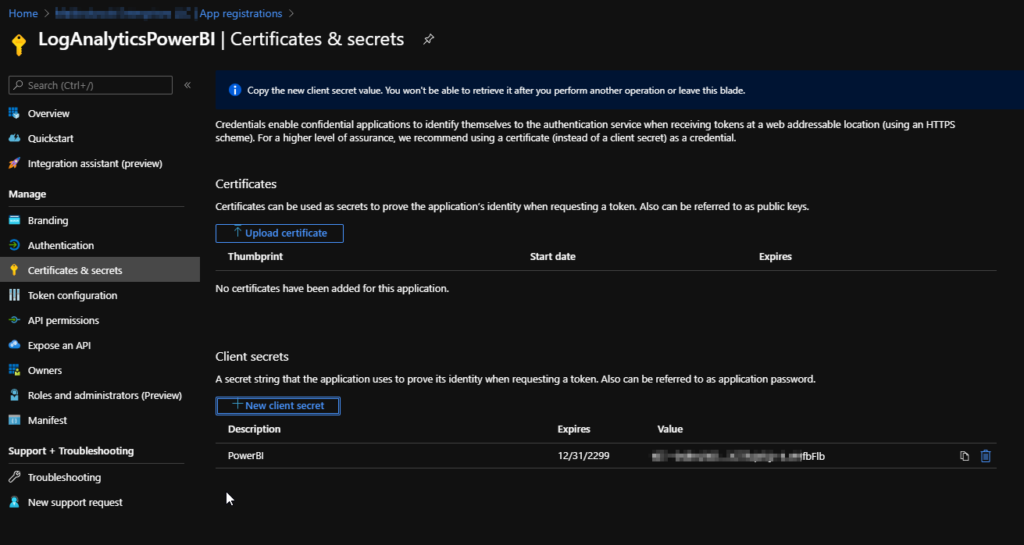
2. Next, generate a new client secret.

Be sure to make note of the client secret as it can not be retrieved once you leave this page.

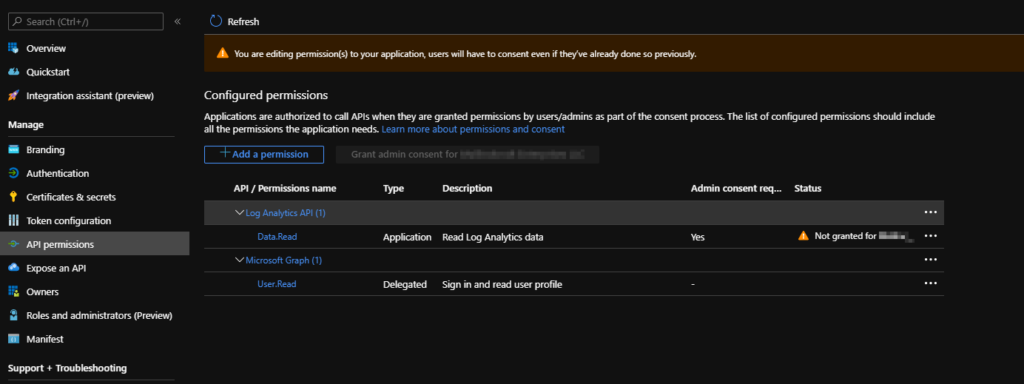
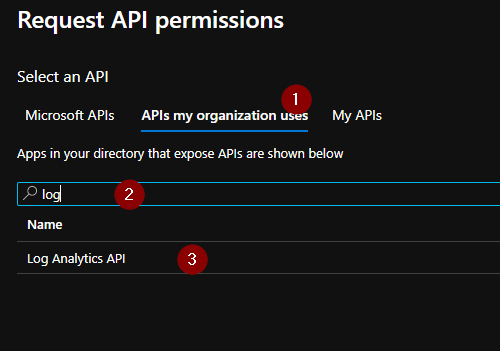
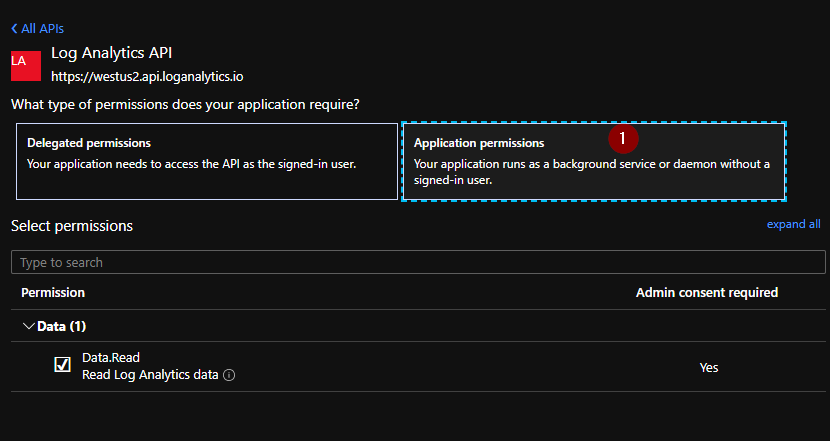
3. Now we need to grant access to the Log Analytics API (Data.Read). To do this, click Add Permission select “APIs my Organization Uses” and search for Log Analytics.

Be sure to select Application Permissions.

Once you’ve added the permission, you need to grant admin consent to the API to interact on the users behalf.

We now have the App Registration almost ready to go. What we’ve done is grant the App Registration the ability to query the Log Analytics API. What we haven’t don yet is grant it access to our Log Analytics workspaces. We’ll take care of that next.

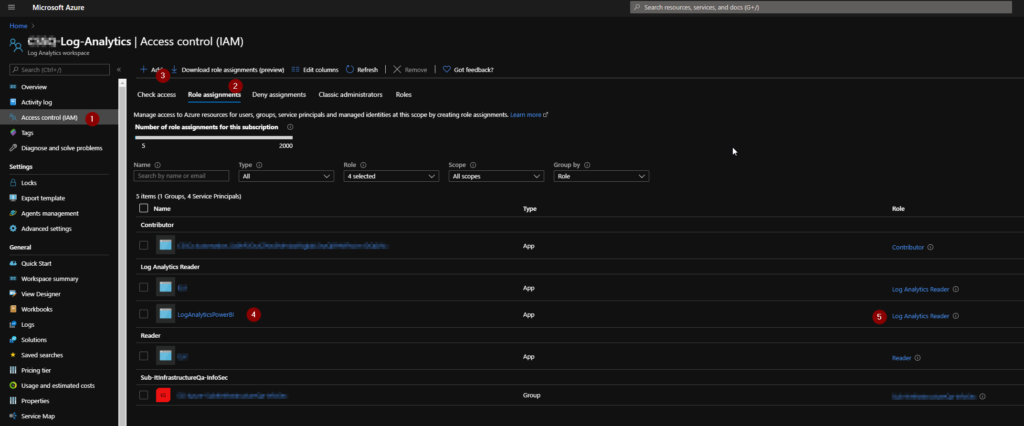
4. Browse to your Log Analytics workspace. We’ll need to add our App Registration to the Log Analytics Reader role. This will grant allow the App Registration the ability to query any table within this workspace. If you want to limit the tables that the app registration is able to query, you will need to define a custom role and assign them to that role instead. I won’t cover creating a custom role in this post, but you can read about how to create a custom role here and see a list of all the possible roles here. You may also want to read through this article to read about the schema for the JSON file that makes up each custom role.

5. Now that the permissions have been granted, let’s run a query. Once you have some results, click on Export and then Export to Power BI (M query). This will download a text file that contains the query. Go ahead an open it up.

The text file will look something like this. If we were to put this into Power BI as is, we could get our data after authenticating with our Organization Account. We’ll take the output and customize it just a bit.

let AnalyticsQuery =
let Source = Json.Document(Web.Contents("https://api.loganalytics.io/v1/workspaces/xxxxxxxx-xxxx-xxxx-xxxx-xxxxxxxxxxxx/query", 
[Query=[#"query"="Usage
| where TimeGenerated > ago(1d)
",#"x-ms-app"="OmsAnalyticsPBI",#"prefer"="ai.response-thinning=true"],Timeout=#duration(0,0,4,0)])),
TypeMap = #table(
{ "AnalyticsTypes", "Type" }, 
{ 
{ "string",   Text.Type },
{ "int",      Int32.Type },
{ "long",     Int64.Type },
{ "real",     Double.Type },
{ "timespan", Duration.Type },
{ "datetime", DateTimeZone.Type },
{ "bool",     Logical.Type },
{ "guid",     Text.Type },
{ "dynamic",  Text.Type }
}),
DataTable = Source[tables]{0},
Columns = Table.FromRecords(DataTable[columns]),
ColumnsWithType = Table.Join(Columns, {"type"}, TypeMap , {"AnalyticsTypes"}),
Rows = Table.FromRows(DataTable[rows], Columns[name]), 
Table = Table.TransformColumnTypes(Rows, Table.ToList(ColumnsWithType, (c) => { c{0}, c{3}}))
in
Table
in AnalyticsQuery

6. Using OAuth is a two step approach. This is commonly known as Two-Legged OAuth where we first retrieve a token, and then use that token to execute our API calls. To get the token, add the following after the first line:

        let ClientId = "xxxxxxxx-xxxx-xxxx-xxxx-xxxxxxxxxxxx",
	ClientSecret = Uri.EscapeDataString("xxxxxxxxxxxxx"),
	AzureTenant = "xxxxxx.onmicrosoft.com",
	LogAnalyticsQuery = "Usage
| where TimeGenerated > ago(1d)
",

	OAuthUrl = Text.Combine({"https://login.microsoftonline.com/",AzureTenant,"/oauth2/token?api-version=1.0"}),
	Body = Text.Combine({"grant_type=client_credentials&client_id=",ClientId,"&client_secret=",ClientSecret,"&resource=https://api.loganalytics.io"}),
	OAuth = Json.Document(Web.Contents(OAuthUrl, [Content=Text.ToBinary(Body)])),

This bit will setup and fetch the token. I’ve split out the Log Analytics query to make it easier to reuse the bit of code for additional datasets. Obviously, you’ll want to put your ClientId, ClientSecret, and Azure Tenant on the first three lines. After that, you’ll want to edit the source line. Change it from:

let Source = Json.Document(Web.Contents("https://api.loganalytics.io/v1/workspaces/xxxxxxxx-xxxx-xxxx-xxxx-xxxxxxxxxxxx/query", 
[Query=[#"query"="Usage
| where TimeGenerated > ago(1d)
",#"x-ms-app"="OmsAnalyticsPBI",#"prefer"="ai.response-thinning=true"],Timeout=#duration(0,0,4,0)])),

to something like this:

Source = Json.Document(Web.Contents("https://api.loganalytics.io/v1/workspaces/xxxxxxxx-xxxx-xxxx-xxxx-xxxxxxxxxxxx/query", 
[Query=[#"query"=LogAnalyticsQuery,#"x-ms-app"="OmsAnalyticsPBI",#"prefer"="ai.response-thinning=true"],Timeout=#duration(0,0,4,0),Headers=[#"Authorization"="Bearer " & OAuth[access_token]]])),

You may notice that we did two things. First, we changed the query to use our variable instead of the text itself. This is done purely to make it easier to re-use the code for additional datasets. The other thing we’ve done is add the Authorization header to the request using the token we obtained from the OAuth line. You should now have something like this:

let AnalyticsQuery =
let ClientId = "xxxxxxxx-xxxx-xxxx-xxxx-xxxxxxxxxxxx",
	ClientSecret = Uri.EscapeDataString("xxxxxxxxxxxxx"),
	AzureTenant = "xxxxxx.onmicrosoft.com",
	LogAnalyticsQuery = "Usage
| where TimeGenerated > ago(1d)
",

	OAuthUrl = Text.Combine({"https://login.microsoftonline.com/",AzureTenant,"/oauth2/token?api-version=1.0"}),
	Body = Text.Combine({"grant_type=client_credentials&client_id=",ClientId,"&client_secret=",ClientSecret,"&resource=https://api.loganalytics.io"}),
	OAuth = Json.Document(Web.Contents(OAuthUrl, [Content=Text.ToBinary(Body)])),
Source = Json.Document(Web.Contents("https://api.loganalytics.io/v1/workspaces/xxxxxxxx-xxxx-xxxx-xxxx-xxxxxxxxxxxx/query", 
[Query=[#"query"=LogAnalyticsQuery,#"x-ms-app"="OmsAnalyticsPBI",#"prefer"="ai.response-thinning=true"],Timeout=#duration(0,0,4,0),Headers=[#"Authorization"="Bearer " & OAuth[access_token]]])),
TypeMap = #table(
{ "AnalyticsTypes", "Type" }, 
{ 
{ "string",   Text.Type },
{ "int",      Int32.Type },
{ "long",     Int64.Type },
{ "real",     Double.Type },
{ "timespan", Duration.Type },
{ "datetime", DateTimeZone.Type },
{ "bool",     Logical.Type },
{ "guid",     Text.Type },
{ "dynamic",  Text.Type }
}),
DataTable = Source[tables]{0},
Columns = Table.FromRecords(DataTable[columns]),
ColumnsWithType = Table.Join(Columns, {"type"}, TypeMap , {"AnalyticsTypes"}),
Rows = Table.FromRows(DataTable[rows], Columns[name]), 
Table = Table.TransformColumnTypes(Rows, Table.ToList(ColumnsWithType, (c) => { c{0}, c{3}}))
in
Table
in AnalyticsQuery

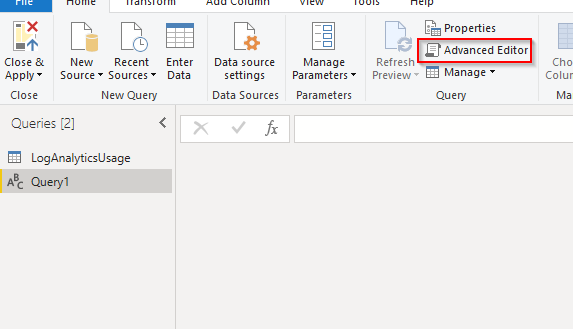
Let’s put that into our query in Power BI. Open Power BI, create a new Blank Query and open the Advanced Editor.

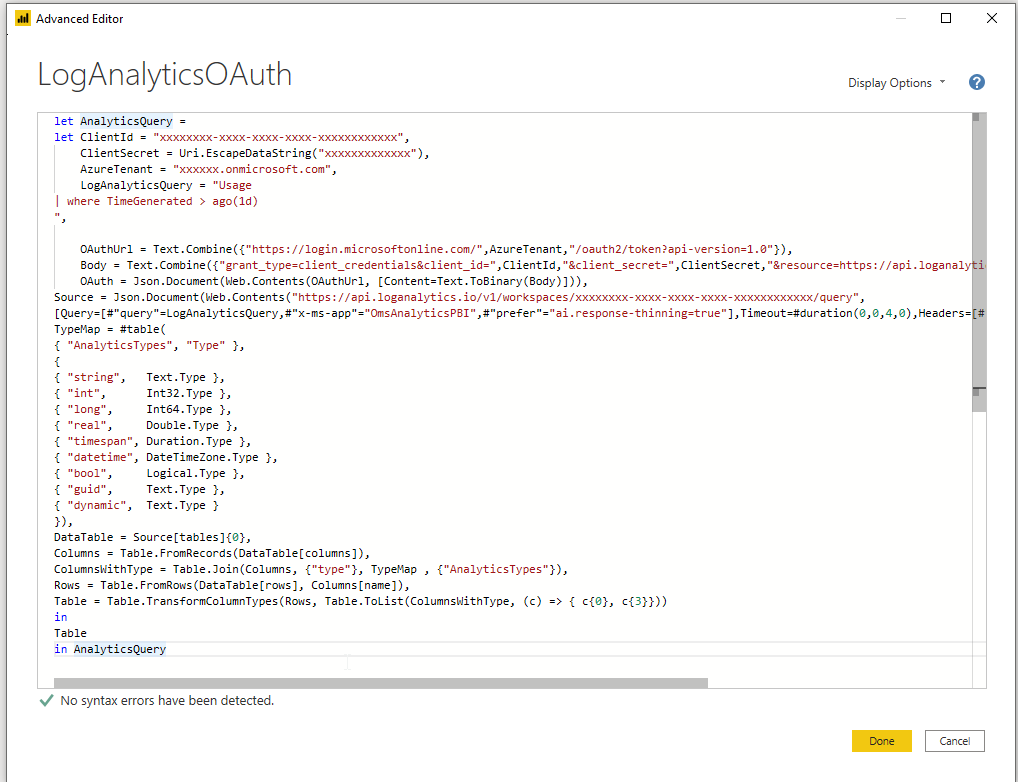
Paste your query and make sure that there are no syntax errors.

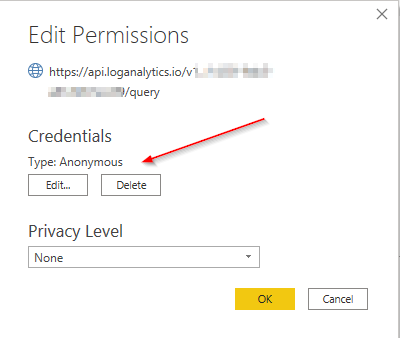
One last thing we will need to do is set our Authentication method to Anonymous. You should be prompted to do so after clicking done, but if not, or you got click happy and dismissed it, you can click on Data Source Settings -> Edit Permissions. If you already have other data sources in your report, be sure to select the one that we just created and change the credentials to Anonymous.

We should now have a preview of our data

Now, if we need to add additional queries, it’s as simple as duplicating the dataset and changing the LogAnalyticsQuery variable on that dataset to the new query.

Building an Azure Connected Fermentation Monitor – Part 1 – The Hardware

Process control is one of the most important aspects of brewing. Sure, I’ve had some great beers that were brewed by people just flopping stuff into a pot. However, without process control, the results are not consistently repeatable. When we talk about process control in brewing, we are usually talking about temperature. Temperature is really everything in beer making and, all else the same, can produce very distinct beers. Temperature can affect just about every characteristic of a batch of beer such as fermentability, mouth feel, flavors, aromas, etc. In this blog post, I’m going to focus on temperature during fermentation and building a controller to do just that. I am going to focus on the hardware here and will do a follow-up post with details about the software. The software that I wrote for this is available on my GitHub space.

How it Works

The fermentation controller works by regulating the temperature during, well, fermentation. There are two outputs on the device, one for a heat source, and one for a cold source. For the cold source, I have a large chest freezer that is large enough to hold four 6 gallon carboys, or a single 60L Spiegel fermenter. When I need to drop the temperature, I trigger the freezer to turn on. Heat is provided using a 100w ceramic reptile bulb. These produce heat, but no light. This is perfect for our use as that’s what we want, heat, no light. By placing everything in a chest freezer, we have a built in cold source, it blocks out light, and it’s insulated so it holds temperature (hot or cold) really well. I’ve been using a Tilt Hydrometer for quite some time along with either their mobile app, or just a Raspberry Pi in a case that I could connect to for viewing the data. With this though, I wanted to have a touchscreen to interact with it and view data or, check on the fermentation away from home.

Parts List

First thing we want to do is gather all of the components that we’ll need for our build. I’ve listed everything out here along with where I bought them and price at time of purchase. There’s a link to the spreadsheet below.

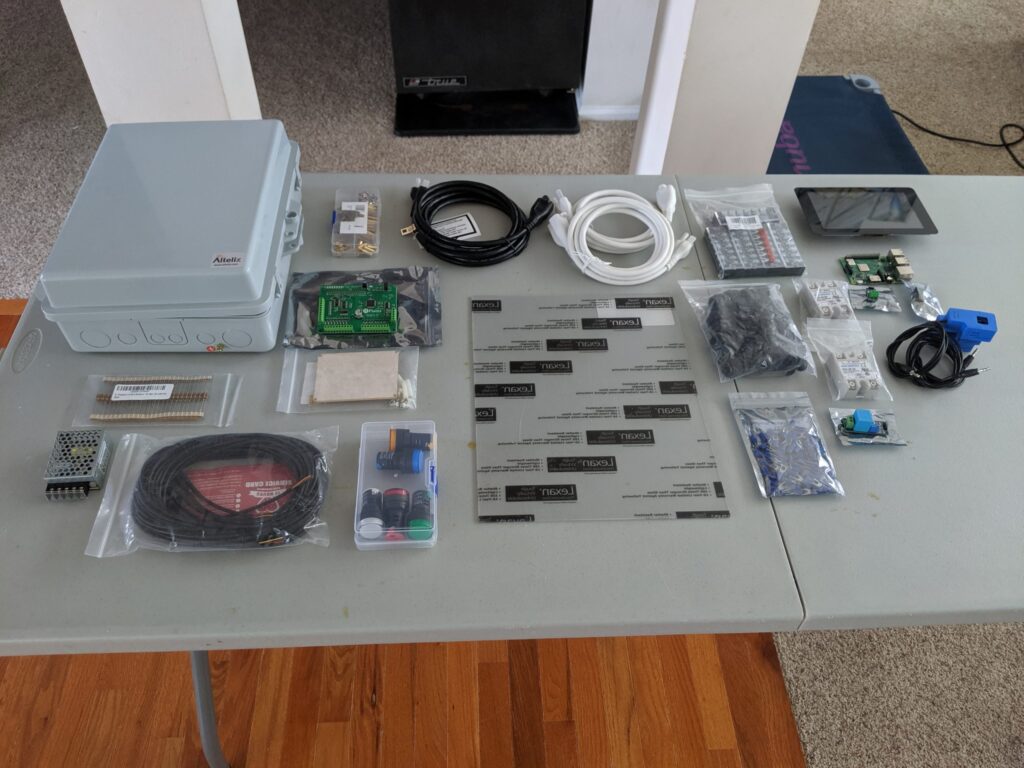
parts
All the parts laid out
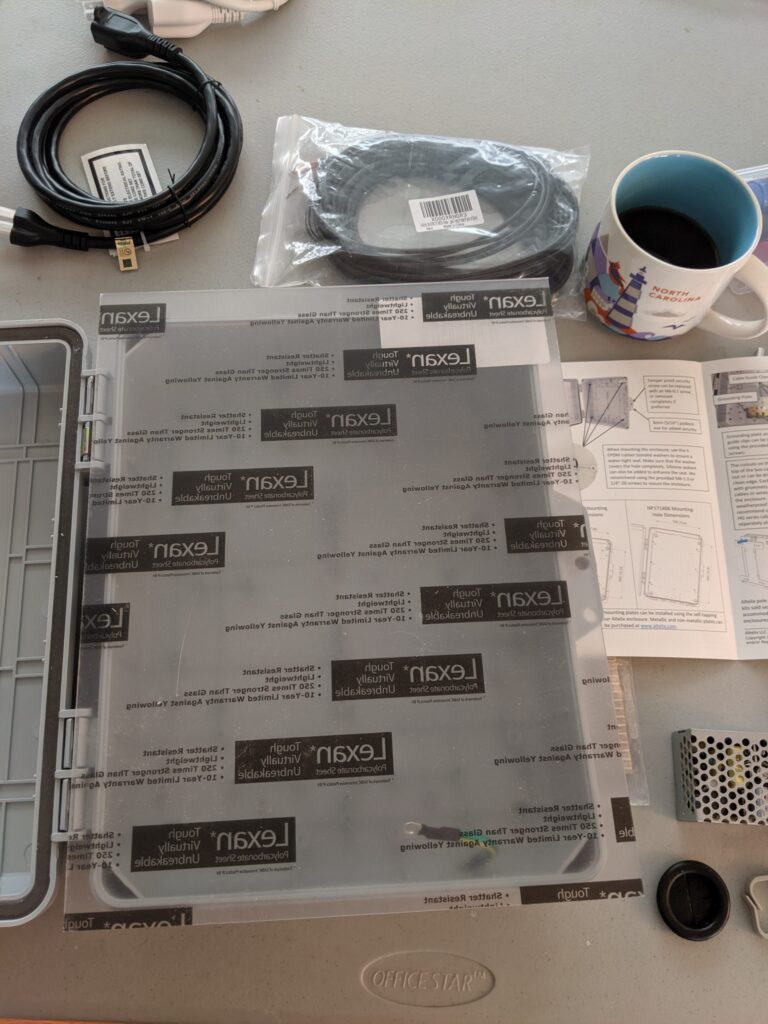
  • 14″x11″x5″ Waterproof NEMA Enclosure
  • 4.7k 1/2w Resistor
  • 5v Power Supply
  • Waterproof DS18B20 Temp Sensor
  • Standoffs
  • Data Aquisition Control Plate
  • DAQC Case Plate
  • LED Panel Indicator Lights
  • 3x Extension Cords (two colors)
  • Polycarbonate Buildplate
  • Terminal Strip Blocks
  • Waterproof Cable Glands
  • Insulated Fork Spade Terminal Connectors
  • 7″ Raspberry Pi Touchscreen
  • Raspberry Pi 3b+
  • 2x 20A Solid State Relay
  • Voltage Sensor
  • 3x 15A Clamp Style Current Sensor
  • Waterproof USB (Not Pictured)
  • Waterproof RJ45 (Not Pictured)
  • SSR Heatsink (Not Pictured)
  • Male XLR Panel Mount (Not Pictured)
  • Female XLR Connector (Not Pictured)
  • Tilt Hydrometer (Not Pictured)

Buy List – Total ~$550

The Build

Assembly starts with putting together the Raspberry Pi and DAQC Plate. Sensors and other items can be connected to the Raspberry Pi via the SPI header. The SPI header utilizes a 3.3v signal to determine state and communicate with connected devices. The Pi unfortunately does not have a built in ADC or Analog/Digital Converter. For this, we utilize the DAQC Plate by Pi-Plates to handle all of our sensors and take care of any analog to digital conversions we may need. Pi-Plates are stackable and have a ready built python library that we can use which makes it very attractive in our case. Now, we could also do this build using an arduino or other misc IoT type of board, however, Tilt comes with a ready-built Raspbian based image that is perfect for what we want to do and doesn’t require us to write our own Bluetooth functions.

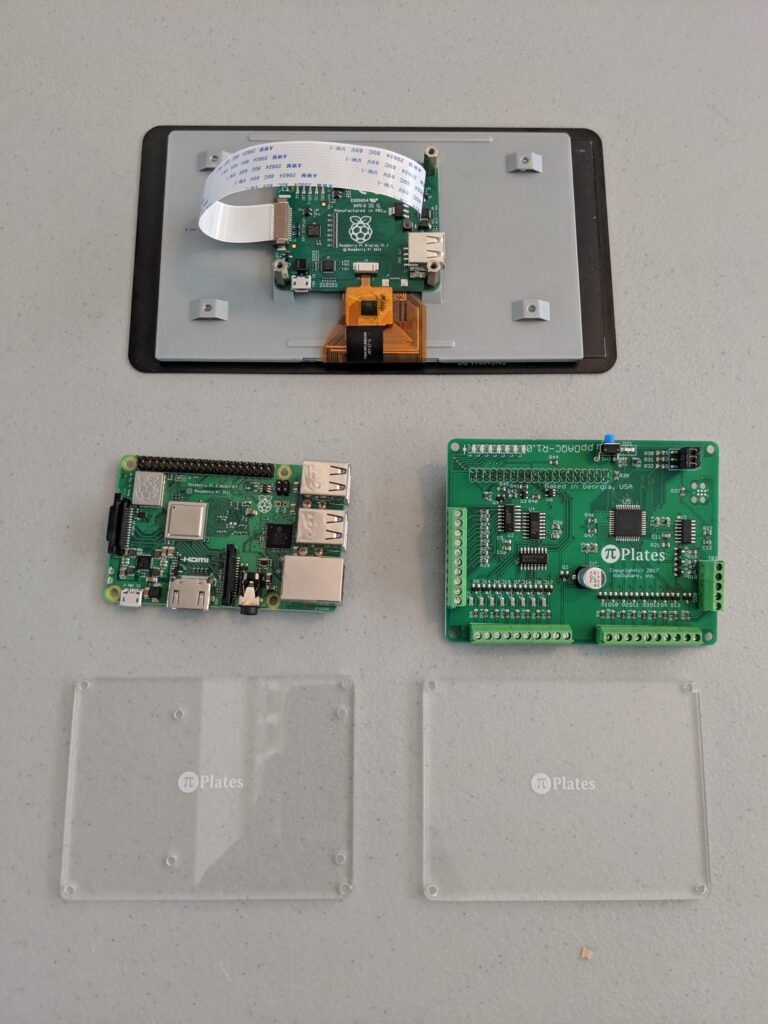
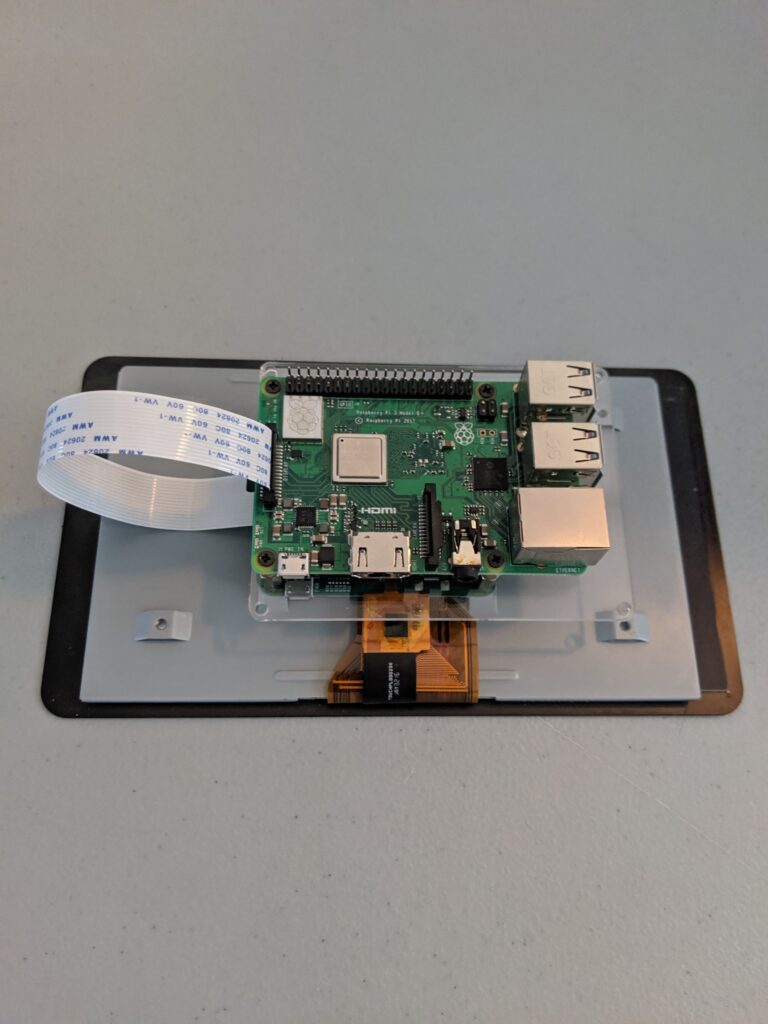
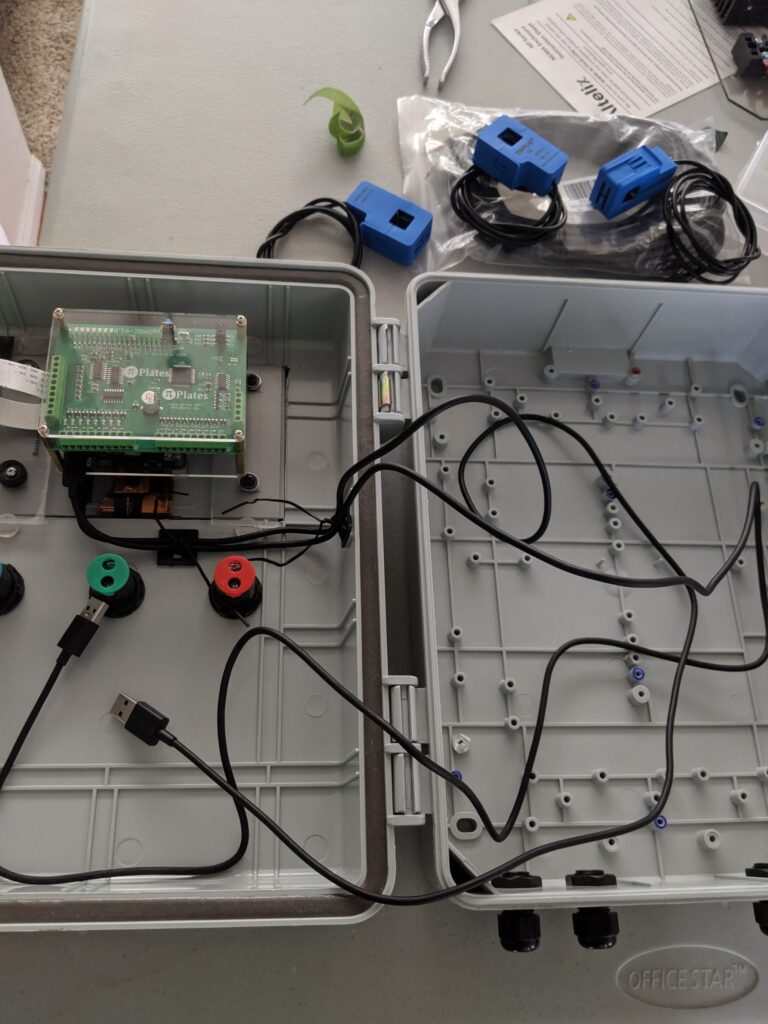
7″ Touchscreen, Raspberry Pi 3B+, DAQC Plate, Case Plate

Above we have the touchscreen, the Pi, the DAQC Plate, and the Case Plate. The mounting holes on the DAQC plate do not line up with the ones on the Pi, so the Case Plate makes mounting a lot easier and helps protect the contacts and provide support for the hardware.

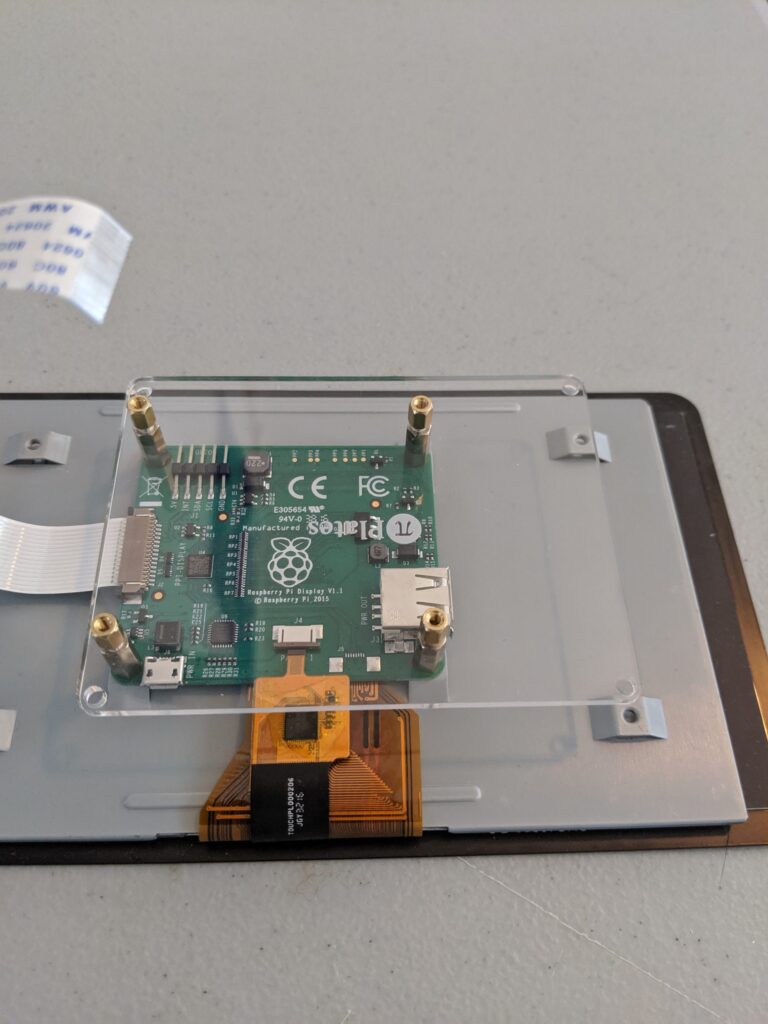
We start by mounting the first plate to the back of the Touchscreen. We then add a couple of the M2.5 standoffs to then attach the Raspberry Pi
Next, we mount the Pi using some M2.5 screws and connect the screens ribbon cable
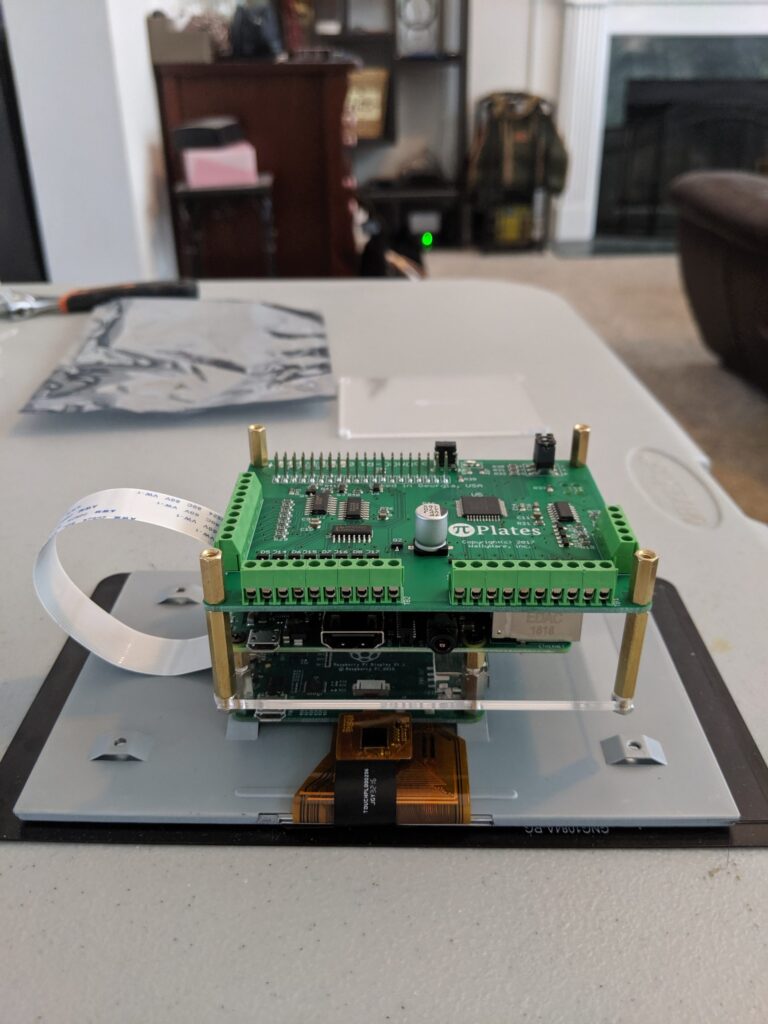
We then add some longer standoffs and mount the DAQC Plate. In this photo, I have some of the brass standoffs that I purchased, But I later swapped them out for the PTFE ones that came with the Case Plate as they were just a little too long and I wanted a better mating at the SPI header.
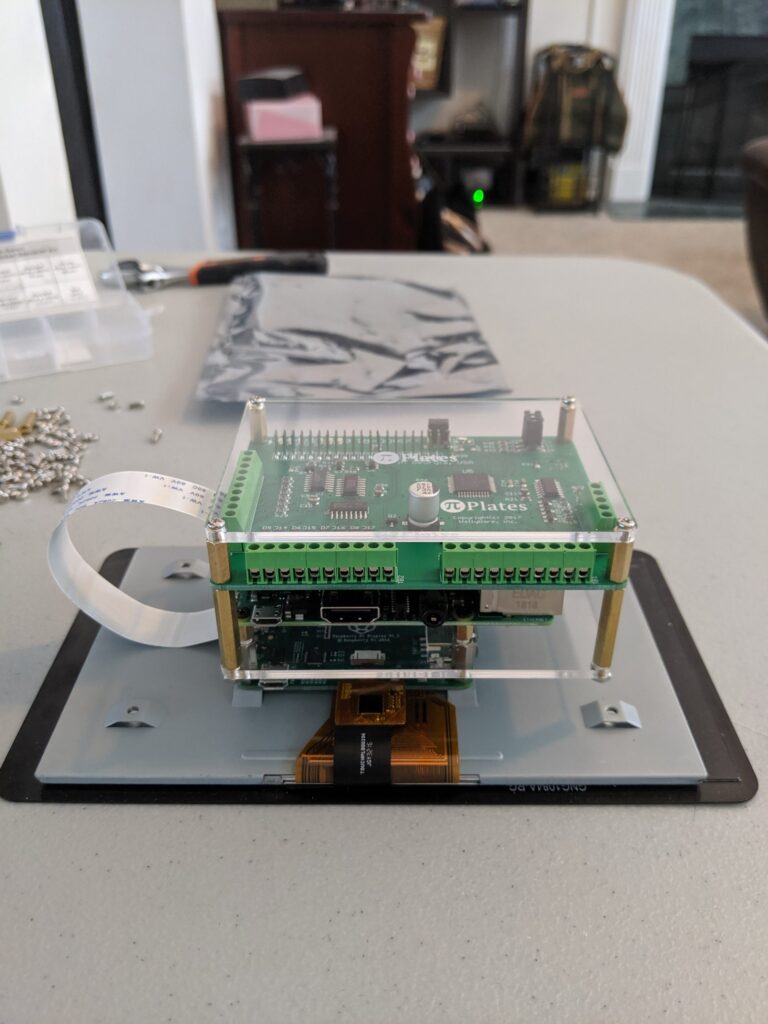
This is what the screen looks like in its assembled form with the Case Plate cover in place.
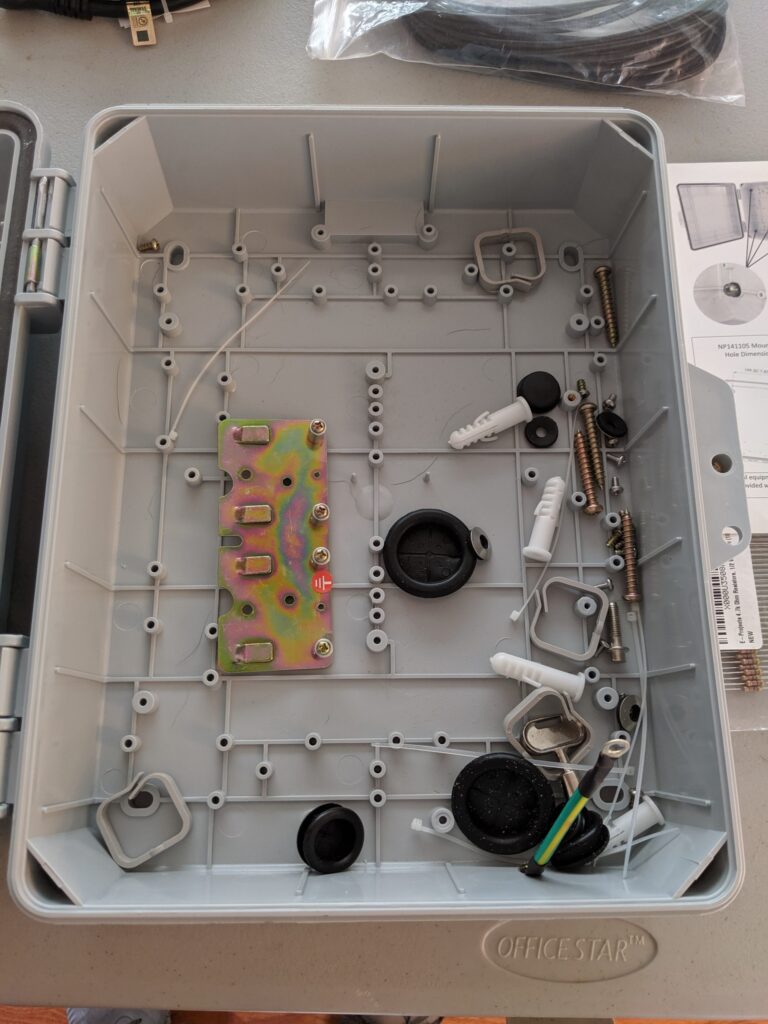
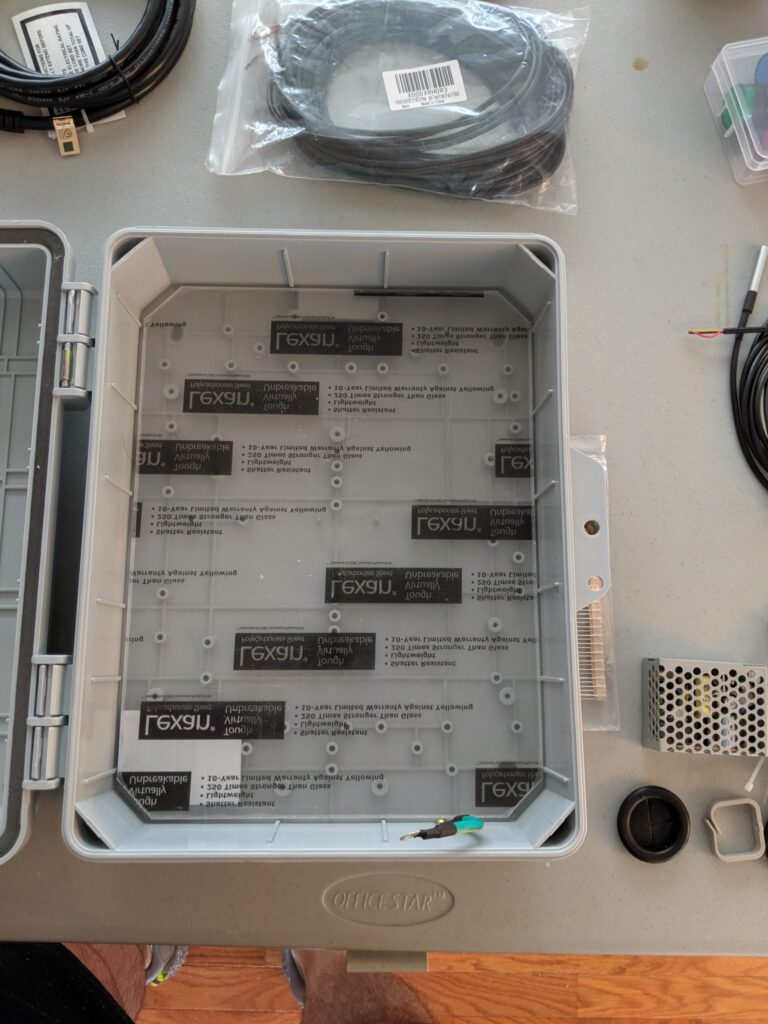
The inside of the enclosure along with the included accessories.
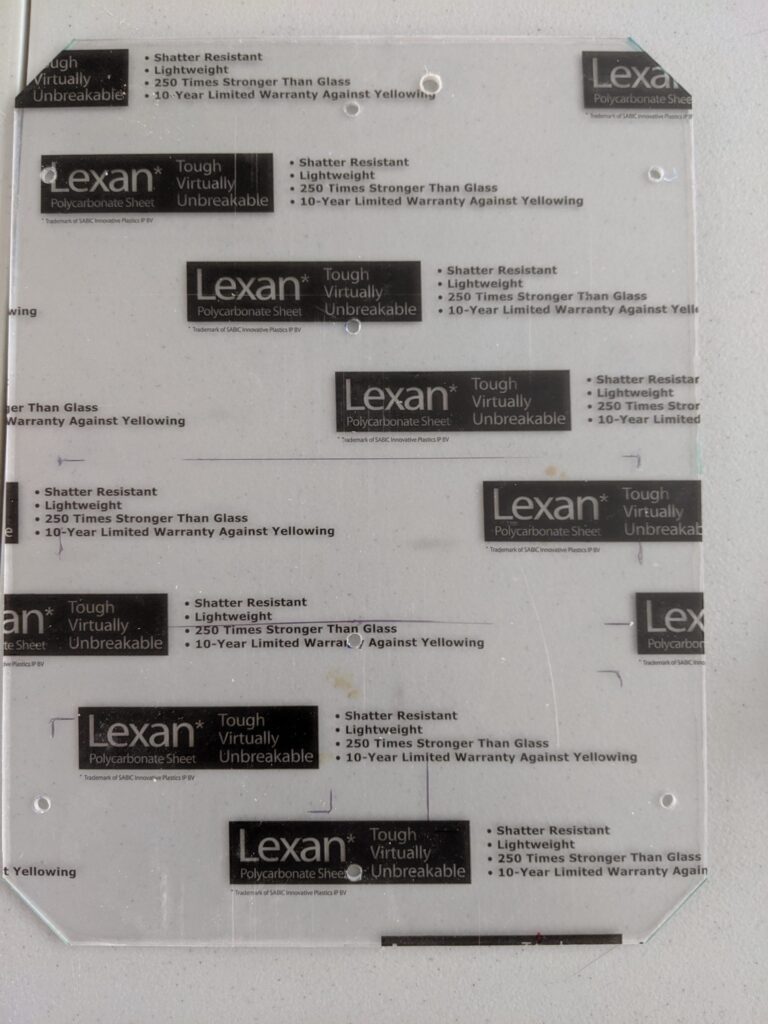
First thing we’re going to need to do is trim the PC sheet to fit inside. This will act as a non-conductive base to mount all of our components to. It will also allow us to easily remove everything should we need to service something down the road.
A few cuts on the table saw and we have a nice fit with a little bit of space on the sides.
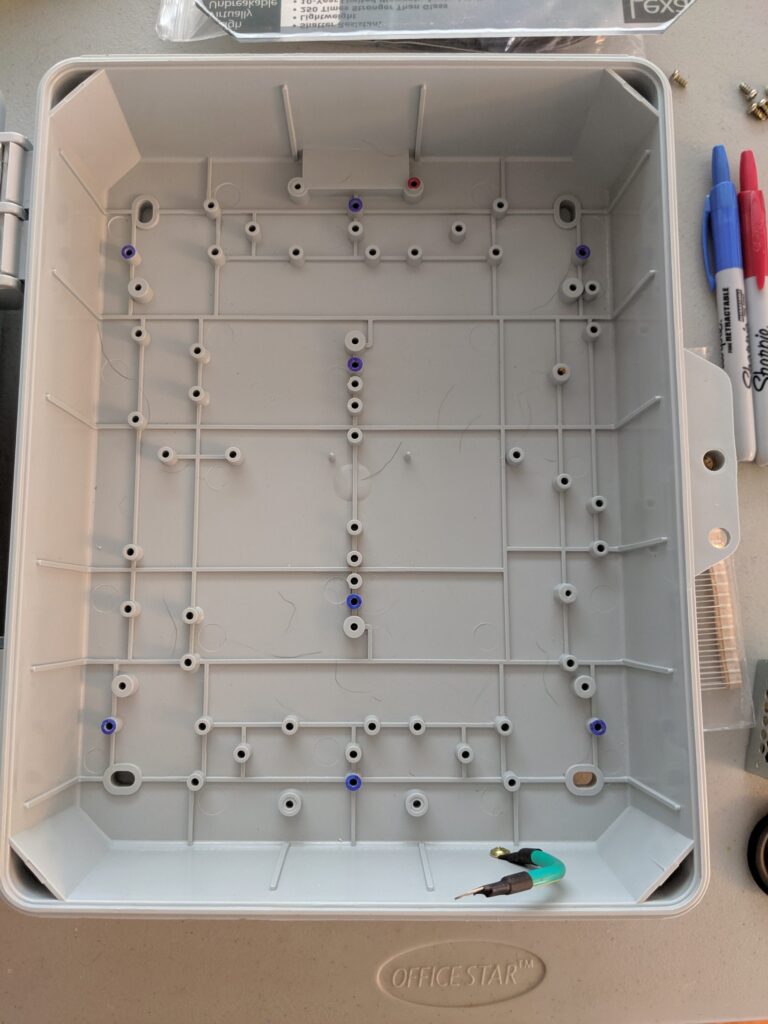
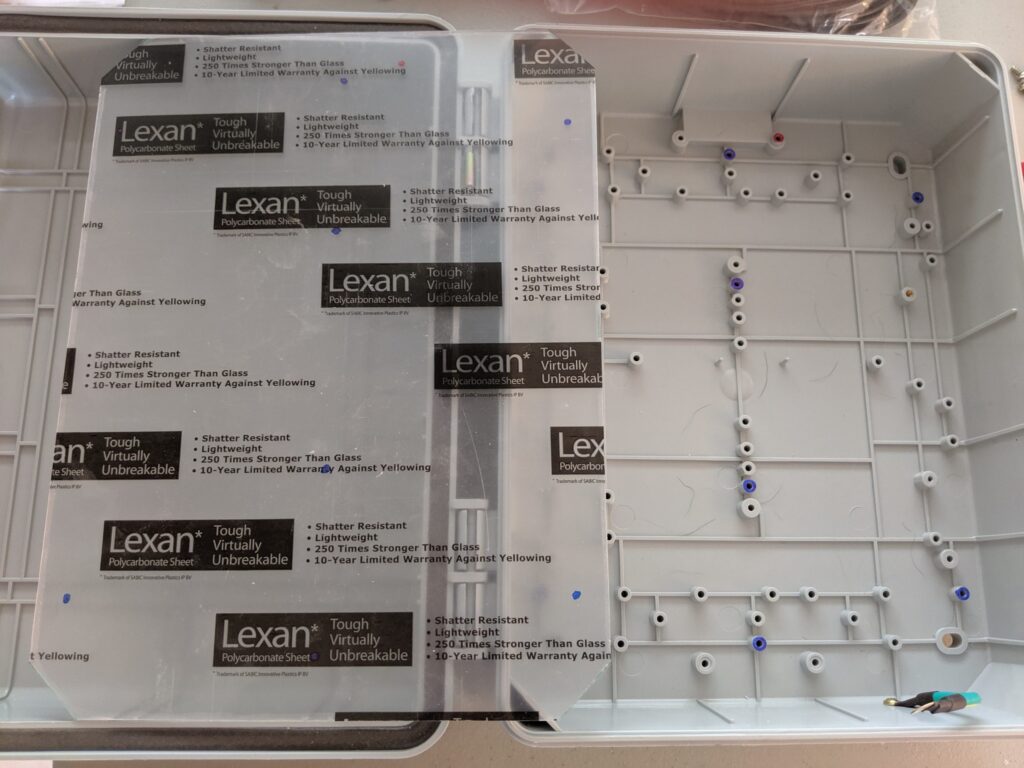
Here I’ve marked all of the standoffs that I will use to mount the PC Sheet to. The standoffs are all varying heights and diameters, but the ones that I colored with a blue sharpie are all the same height and diameter. The one in red protrudes a bit above the rest, so we’ll need to drill a larger hole to accommodate that one so that it doesn’t cause the PC to bend or possibly crack.
I placed the PC sheet inside and transferred the location of the standoffs using the same colors.
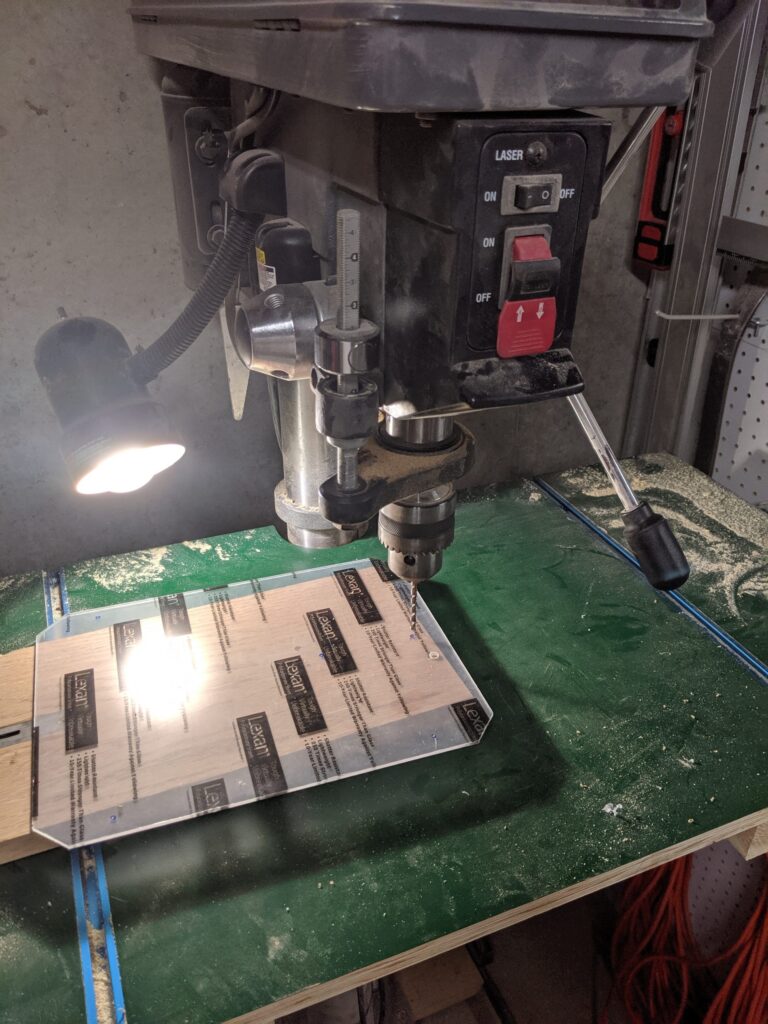
I drilled each of them out using a drill press. If you don’t have a drill press, you can use a hand drill, but be careful that you keep the drill steady as PC can be easy to crack.
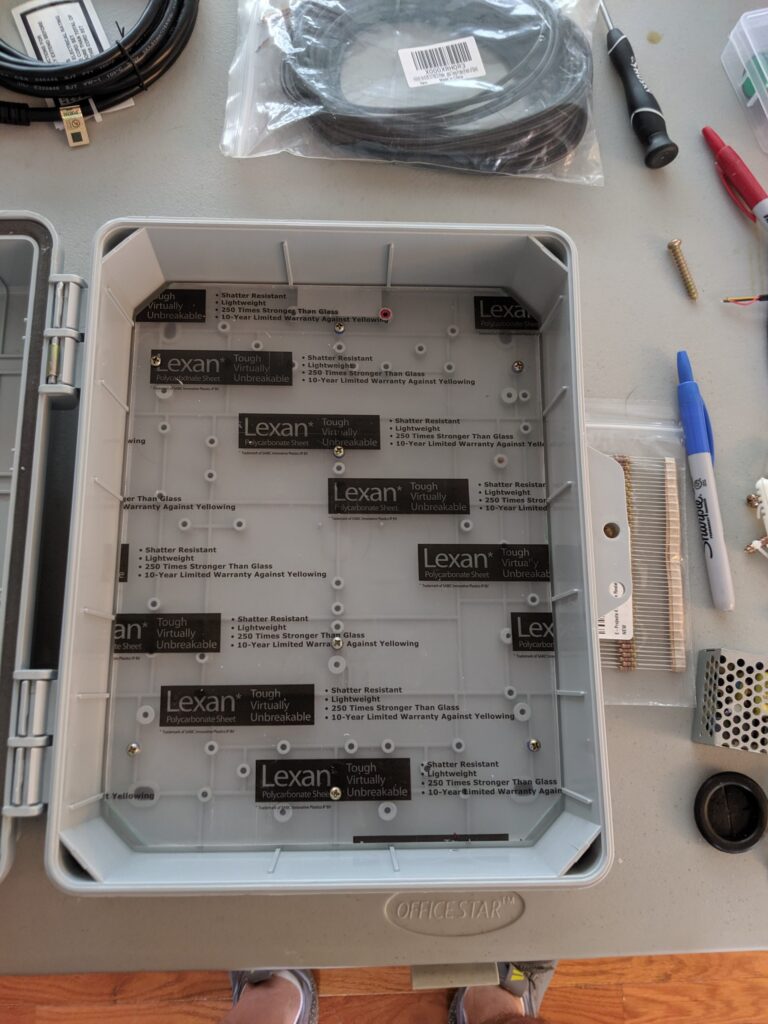
After drilling, I placed the sheet into the enclosure and made sure everything fit up correctly. Now is the time to make adjustments if you need to.
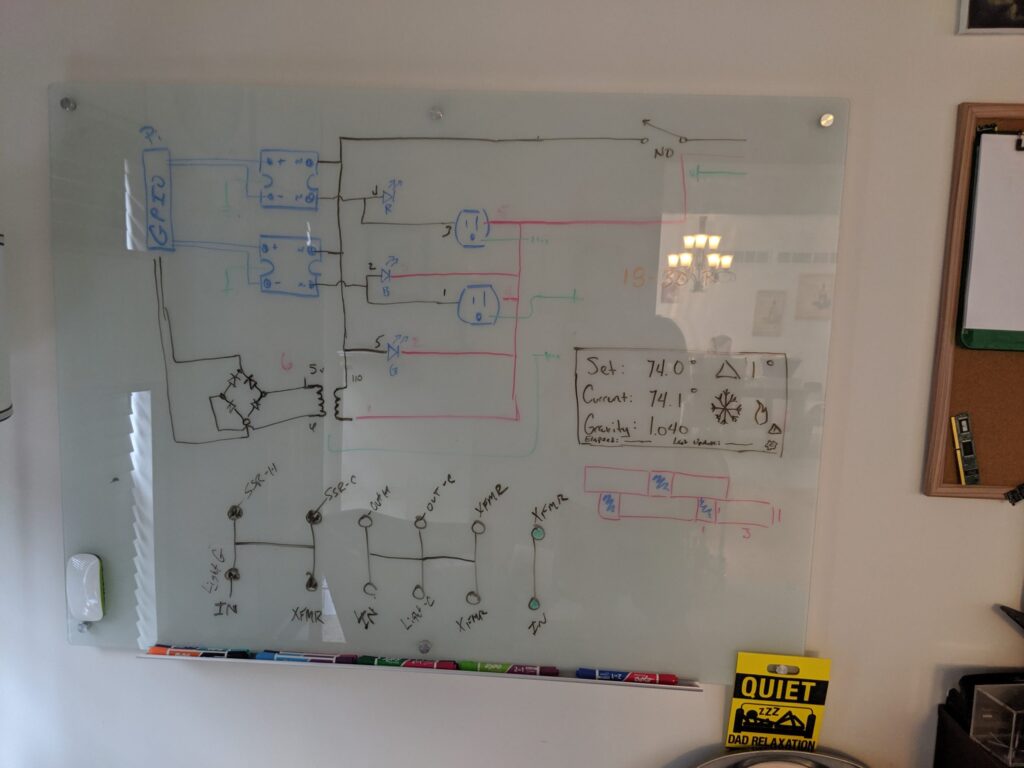
I drew up a simple wiring diagram to get an idea for how everything would be connected before I started placing components. It’s typically good to have a plan for how things will connect as it can make placement easier if you know where your cables are going to have to go.
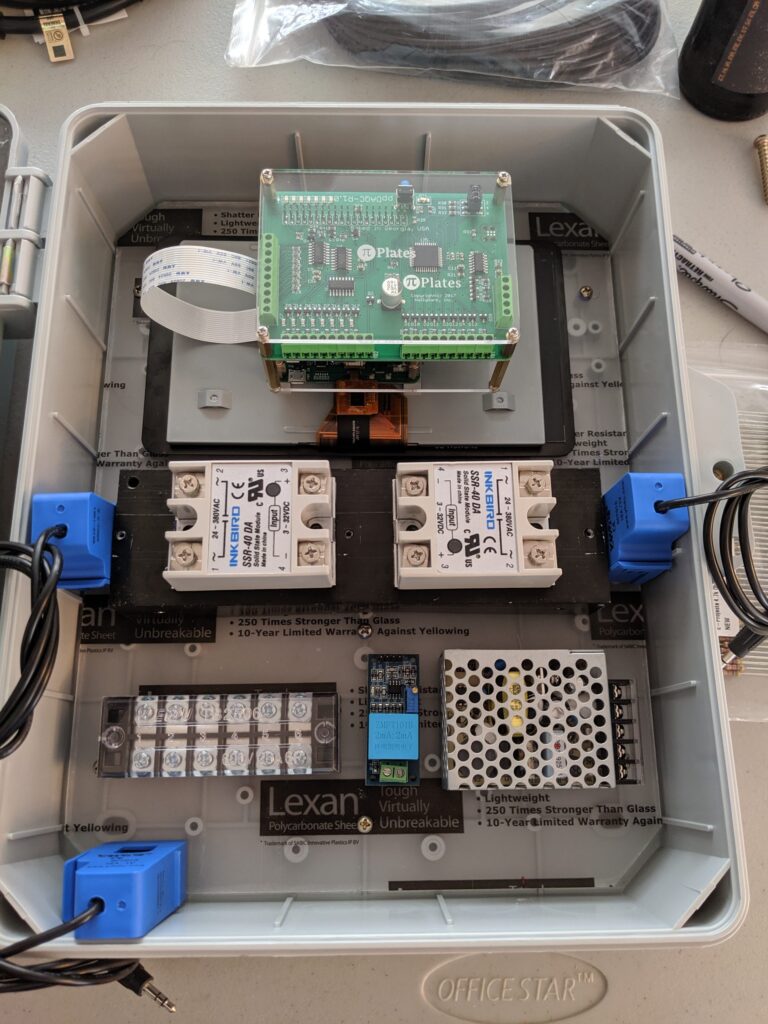
Before permanently mounting anything or drilling holes, I dry fit everything together to make sure I had room for everything for all of the components as well as the wires that would be run. The Pi does not mount to the backplate, but I wanted to make sure my components were spaced so that nothing would hit it when the cover was closed.
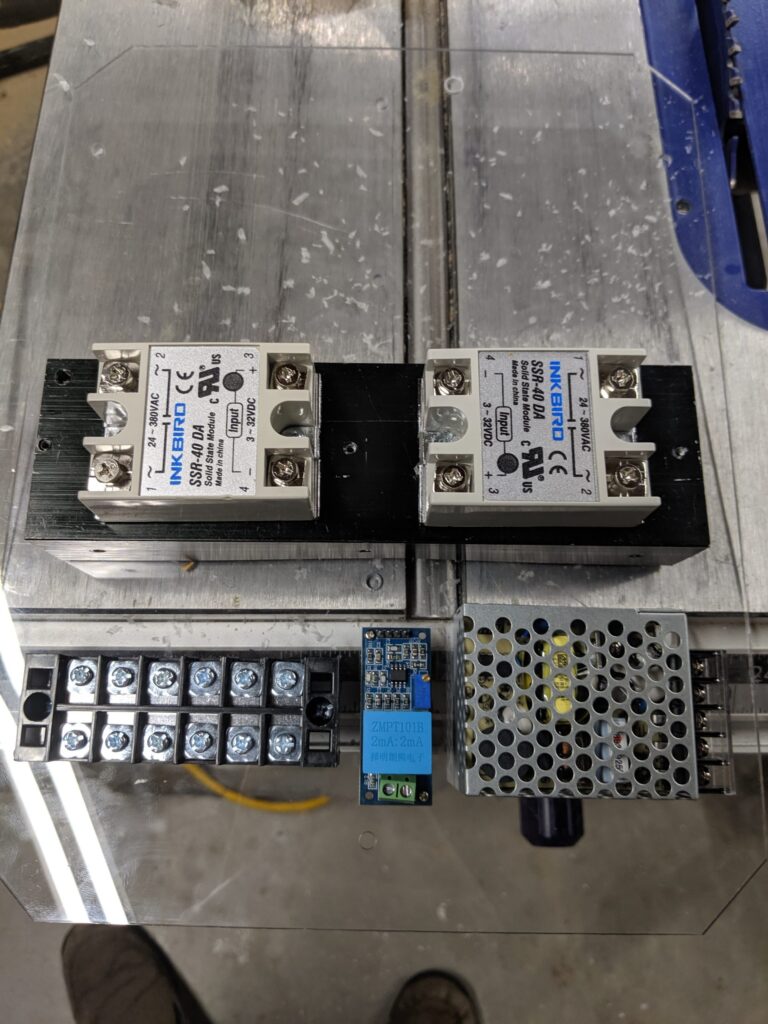
While the components were in place, I traced out their locations so that I could drill the holes for mounting.
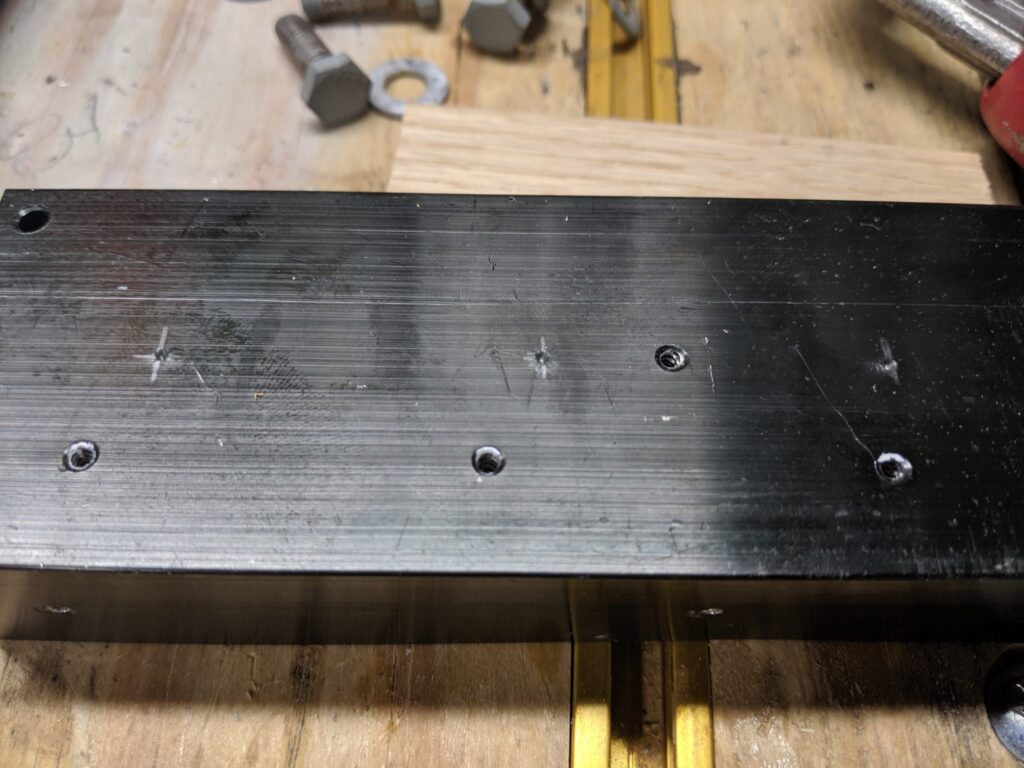
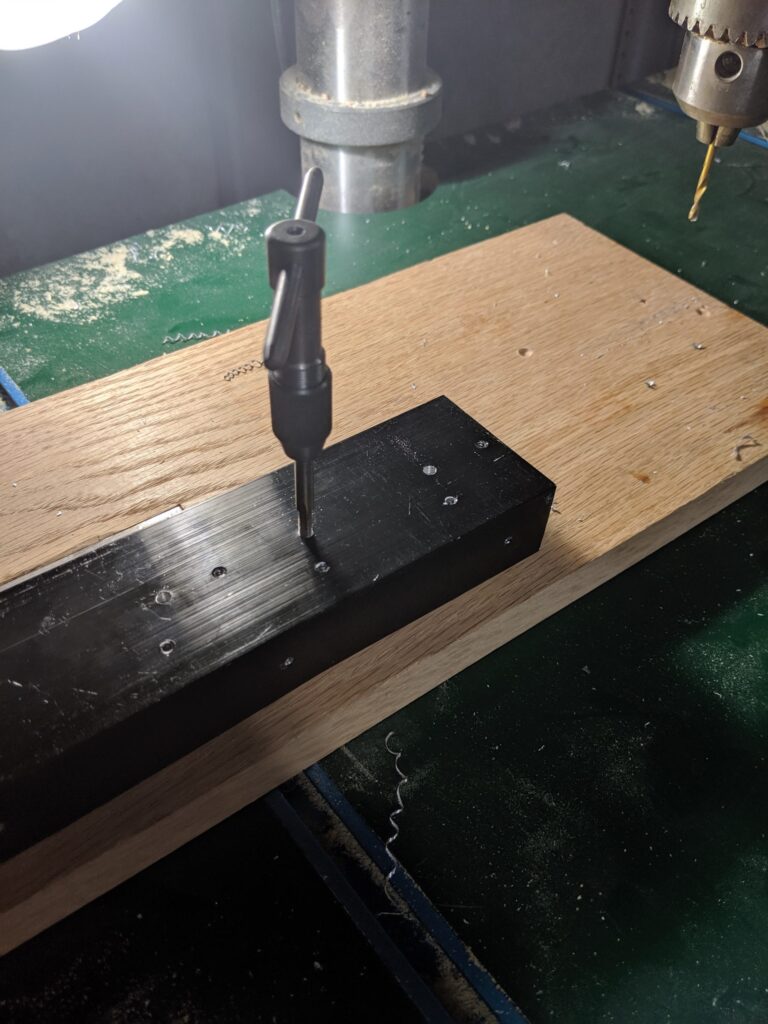
First thing is to drill the mounting holes for the SSRs onto the heatsink. I use a centering punch here to help keep our drill bits from walking when we start to drill. I had a few heatsinks that measured about 9″ x 1″ x 3″ that I had salvaged from some old audio amplifiers many years ago. This project is probably the first (and likely only) time my stockpile of random bits of circuitry was helpful.
With the holes drilled we can tap them to receive our screws. I think I used either M4 or 10-24 screws here.
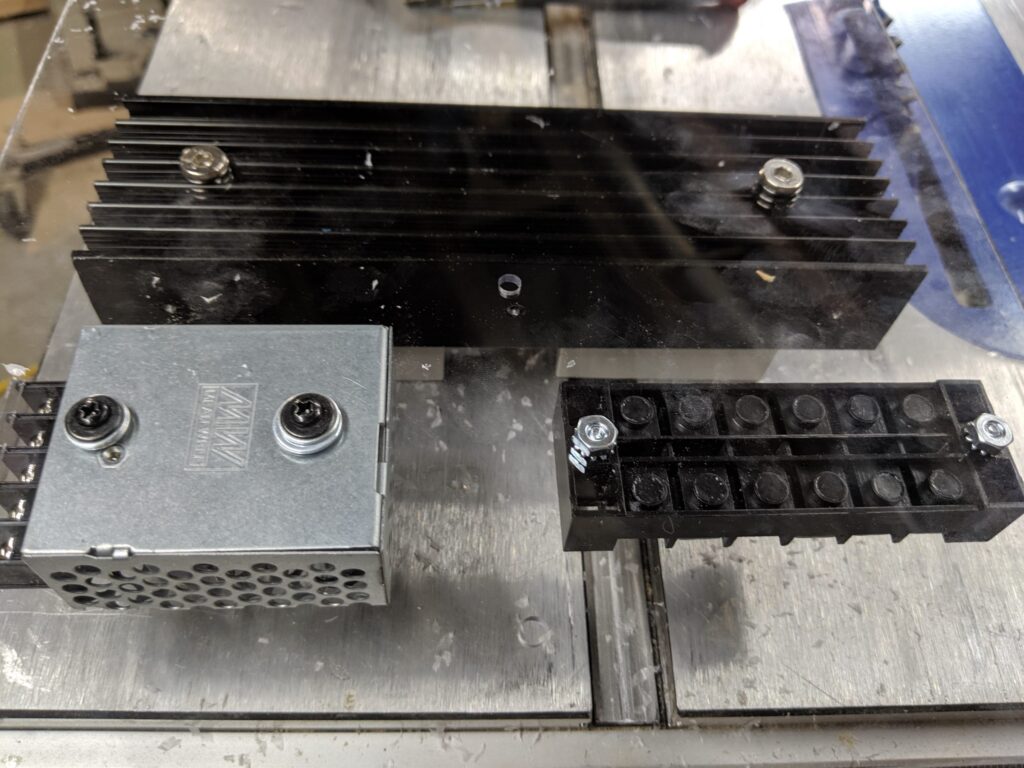
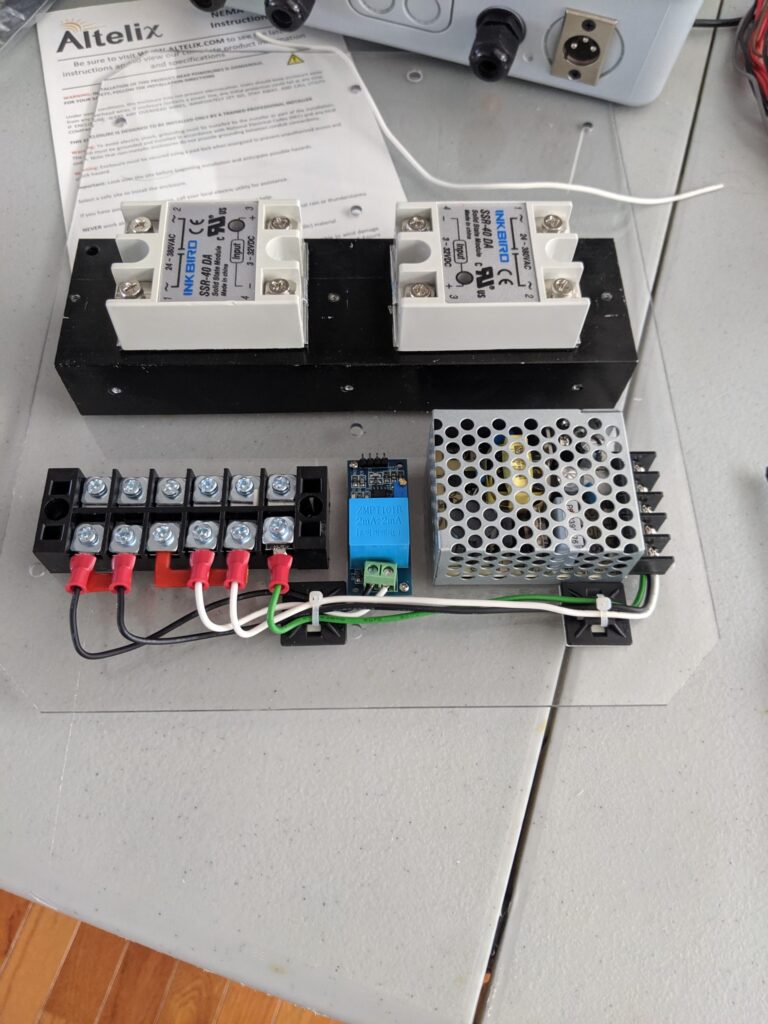
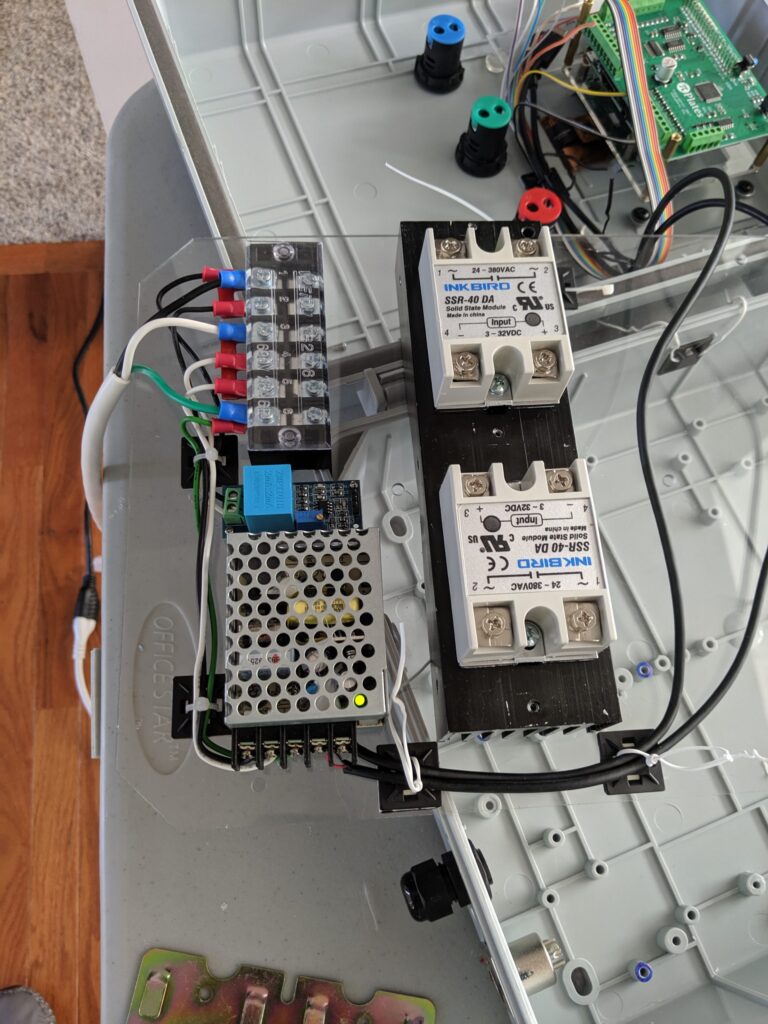
With the SSR’s mounted, I can mount the other bits to the base board
Last thing to mount is the voltage Sensor
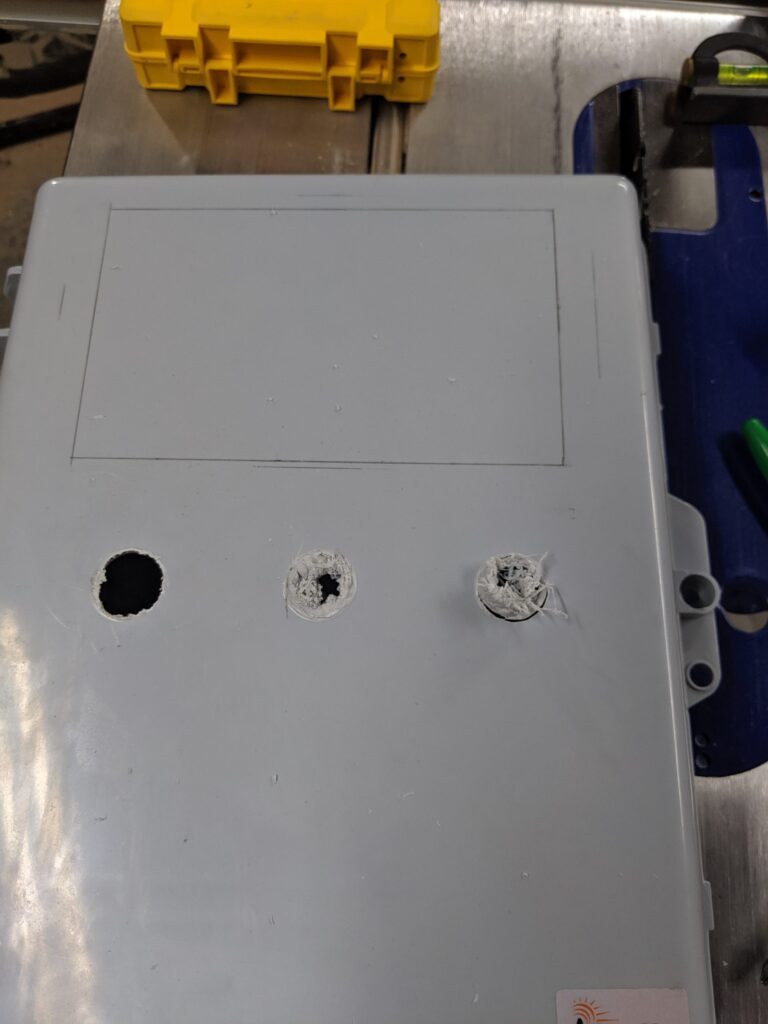
Next, we move on to cutting out the front of the enclosure
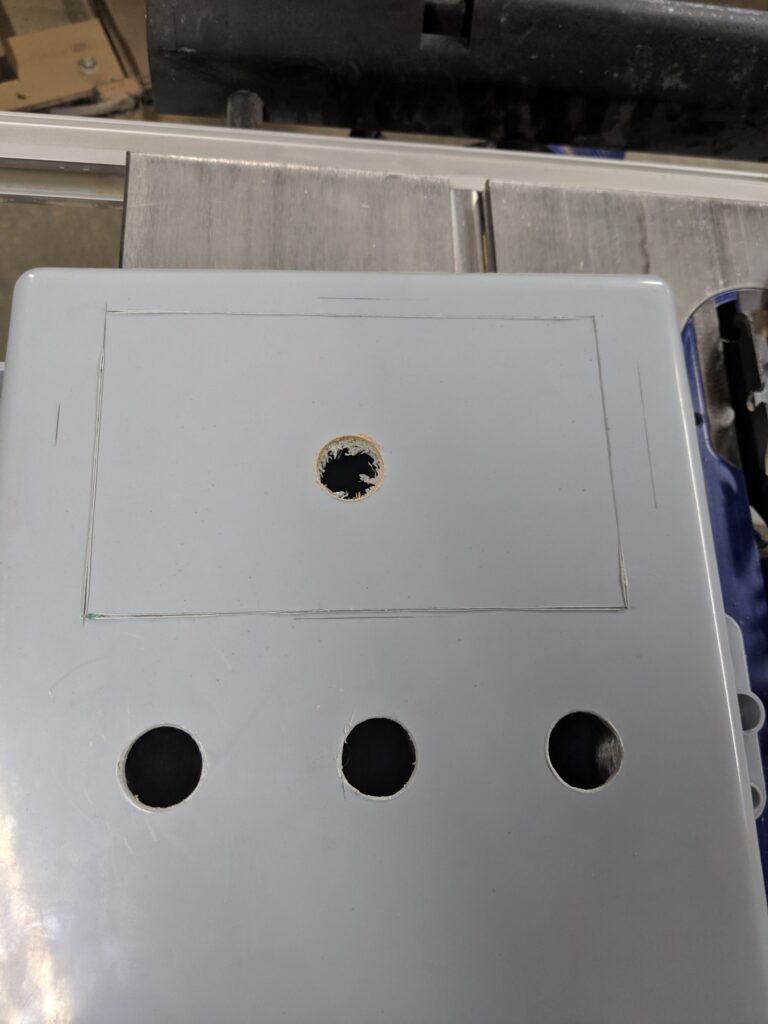
After cleaning up the LED holes, I moved on to the hole for the display
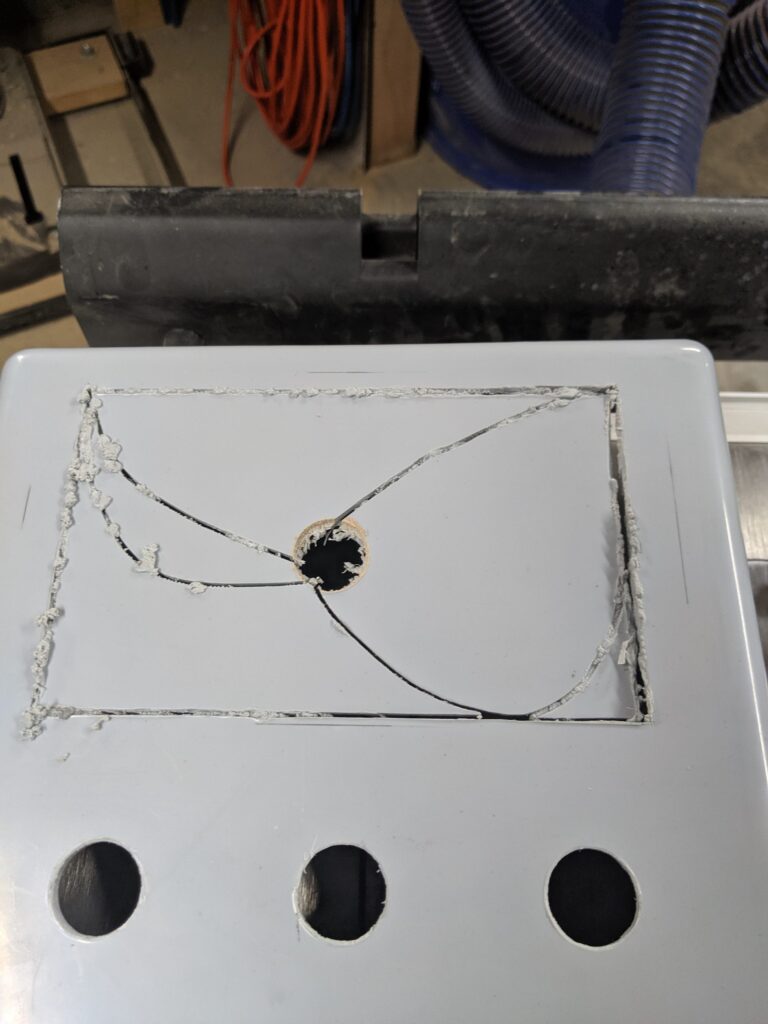
These were cut out with a Jigsaw. When the blade is cool, it makes nice clean cuts. However, as the blade heats up, it starts to melt shavings instead of dumping them. If you’re patient, and let the blade cool before continuing to cut, you can avoid this. Patience, unfortunately, is a skill that I lack along with X-Ray vision and super human strength.
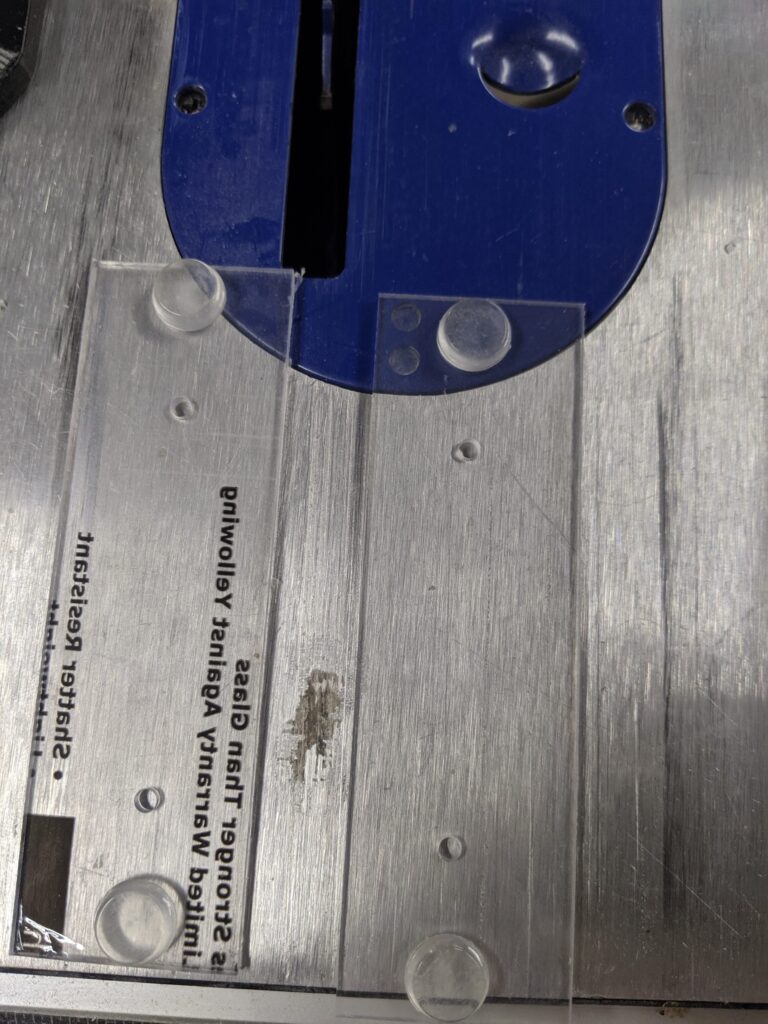
To mount the LCD, I use some of the scraps of PC to make strips that will clamp the screen to the front. I put a couple of those soft rubbery feet things on each to add a bit of tension and grip.
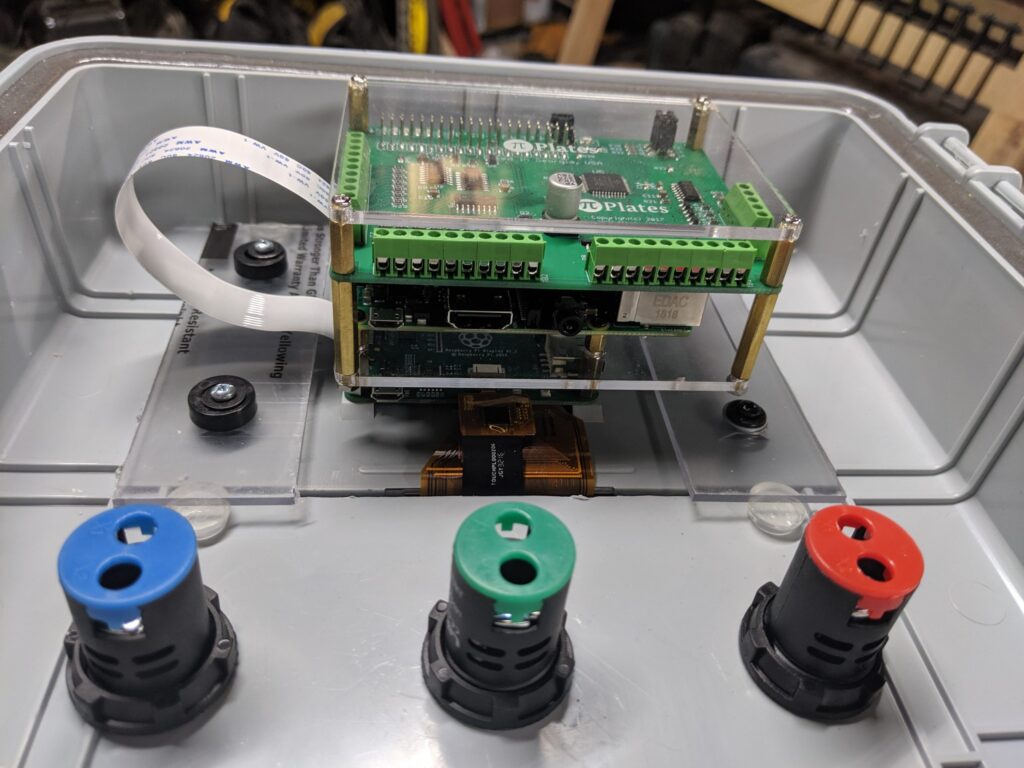
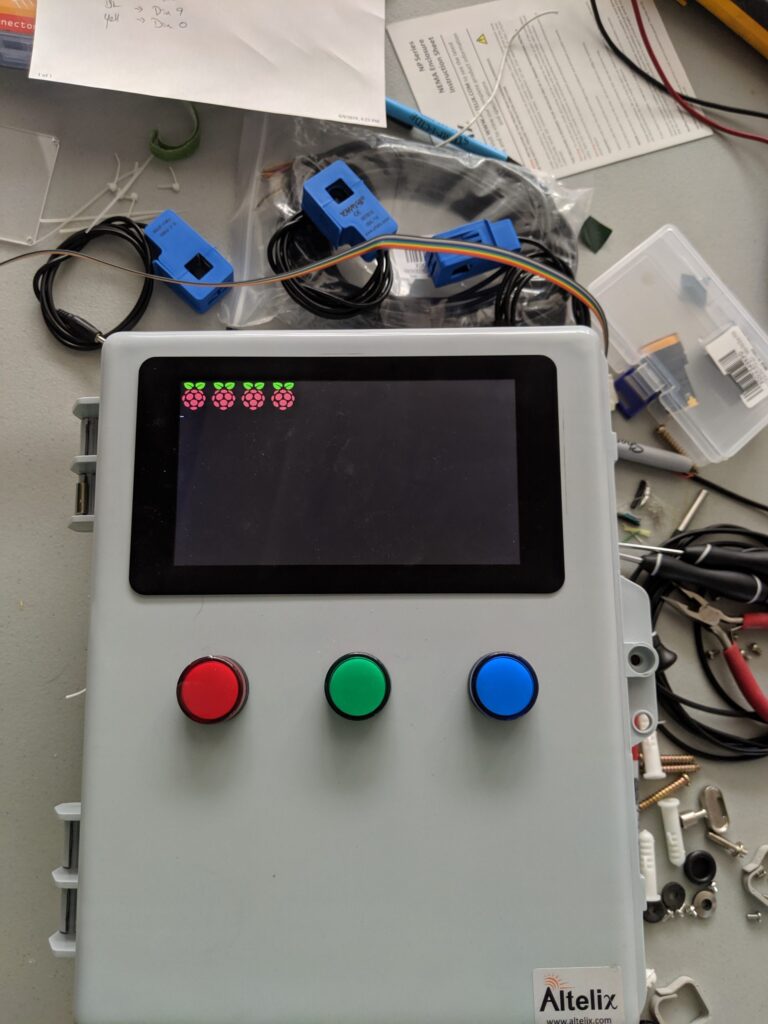
An inside look at the screen and LEDs after being mounted
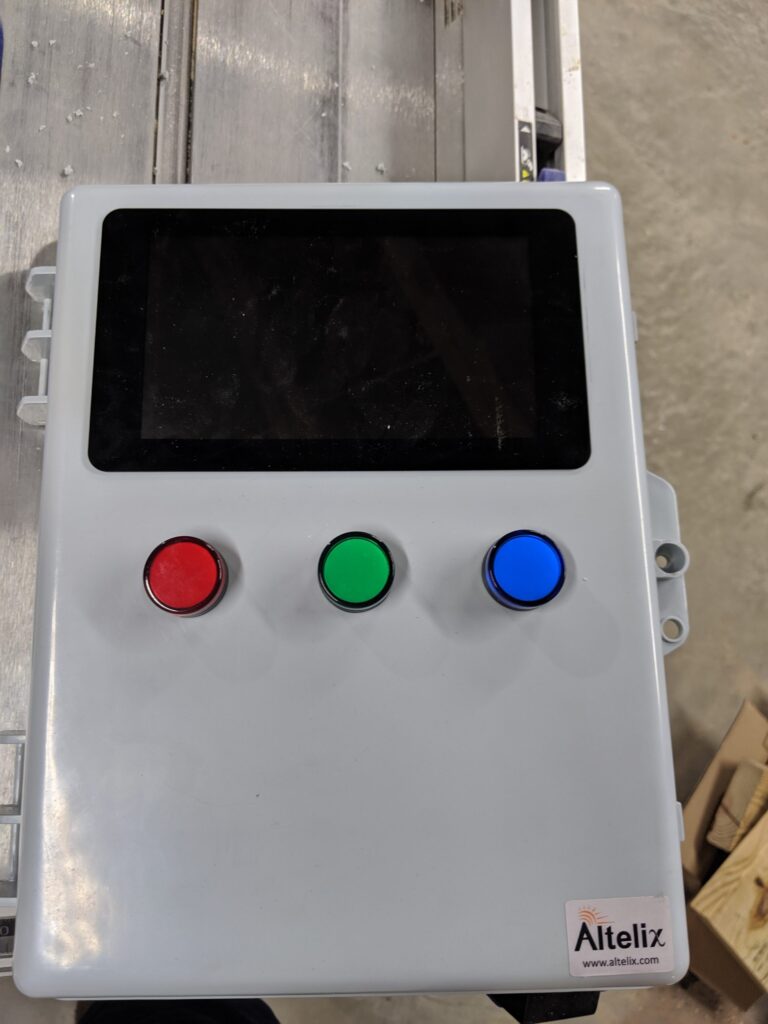
And a view from the front.
Wiring starts with connecting the voltage sensor and 5v power supply. I used a slightly smaller gauge wire here since these two devices have a much lower draw and have their own fuse to prevent over drawing.
To supply power the the Pi and Screen, I took a couple of Micro-USB cables that I had laying around. These will both connect to the 5v power supply. I’m using twist-ties to keep the cables in place for now as I’ll be adding more and will swap them out for cable ties once all the wire is in place. I’ve also drilled and mounted the cable glands and male XLR connector on the bottom of the panel. I didn’t remember to take a picture of that though. I think the drinking started one or two pictures above this.
The red and black wires from the USB cables connect to our output terminals on the power supply
As with most components and sensors, some adjustment is needed out of the box to ensure that our outputs or signals are correct. We just needed to adjust this one a hair.
Before I went any further, I made sure that the Pi booted up and worked with the power supply.
Wiring continues as components are wired up and cables are routed. You can see my input wire in the lower right (black) as well as the two outputs (white) and XLR connector for the temp probe. For the input, I cut the female (receptacle) end off the black extension cord which left me with the plug on the other end that I can plug into the wall to power the unit. For the outputs, I cut about 12″ from the female end and used those as tails to plug the freezer into. The rest of the wire was removed from the outer jacket to wire the internal components.
Another quick boot to make sure we didn’t fry anything and to check our wiring.
Next we add the current sensors. One for the main, and one each for the cold and hot side.
Next, we connect the SSRs to the DAQC plate and wire up the XLR connector. We have to add our 4.7k ohm resistor here to get accurate readings.
Pictures can sometimes be hard to see what connects to what. Hopefully this illustrates it a little bit better. The SSRs connect to the digital outputs on the left. We need to use a jumper here between the first and second to last pin as a safety. Our current and voltage sensors (the signal pin at least) connect to our analog inputs in the lower left. Our temp sensor and the ground for everything except for the SSRs connect to the digital inputs on the lower right.
Remember how I said we have to adjust some components? This is the output from the voltage sensor. This *should* be a nice sine wave. This is an oscilloscope that my Uncle gave me over 20 years ago. I had never used it… Until Now. The only time my reluctance to throw anything away has come in handy.
After adjusting, we now have a clean wave and can take accurate measurements. This adjustment has to be done with the power on, so be careful doing this as you have exposed electrical components. Making contact with the wrong part could damage your equipment or you.
I wrote up a quick python script to check the voltage and amperages. We’re getting readings, although the amperage is off.
Our completed build. S = Set or Target Temperature, V = Value or Current reading, G = Gravity, Delta is the amount above or below the set temperature the unit trigger the cold or heat.
Setting the target temperature
Other setting adjustments along with the ability to reboot or power off the device.

Now you might be wondering about how I got the screen to look the way it does. That’ll be covered in my next blog post, but I have uploaded the source code to GitHub if you want to rummage through it. There’s a couple things we need to do to get it to work from the Pi side, but I’ll cover all of that in the next post. Here’s what our data looks like:

Gravity Readings over the course of a day
Temperature. You can tell where I started cold crashing.

Performance PowerShell: Part 1


About Performance

This past November, I had the privilege of speaking with Nathan Ziehnert at MMS Jazz Edition in New Orleans, LA about PowerShell Performance. If you haven’t heard of his blog (Z-Nerd), you should definitely check it out. I’ve been meaning to write more blog posts, and I though that our topic would make a great post.

PowerShell script performance is often an afterthought, if it’s even a thought at all. Many times, we look at a script and say “It’s Works! My job here is done.” And for some instances, that’s good enough. Perhaps I’m just writing a single run script to do a one time task and then it’ll get tossed. But what about the rest of our PowerShell scripts? What about all the scripts that run our automation, task sequences, and daily tasks?

In my opinion, performance can be broken down into three categories: Cost, Maintainability, and Speed. Cost in this regard is not how much money it costs to run a script in say Azure Automation, but rather what is the resource cost on the machine that’s running it. Think CPU, memory, and disk utilization. Maintainability is the time it takes to maintain or modify the script. As our environment evolves, solutions get upgraded, or modules and snap-ins get code updates, we need to give our script the occasional tune-up. This is where format, and good coding practices come into play. Lastly, we have speed. This first blog post will focus on speed, or how fast our scripts run.

Disclaimer

What I’m covering here is general. While it may apply to 99% of use cases, be sure to test for your individual script. There are a lot of factors that can affect the speed of a script including, but not limited to, OS, PowerShell version, hardware, and run behavior. What works for one script may not work for the next. What works on one machine, may not work on the rest. What works when you tested it, will never work in production (Murphy’s Law)

What Affects Performance?

There are quite a few things that can affect performance. Some of them we can control, others we can’t. For the things we can’t control, there are often ways to mitigate or work around the constraints. I’ll take a look at some of both in this post such as:

  • Test Order
  • Loop Execution
  • .NET Methods vs. Native Cmdlets
  • Strong Typed/Typecasting
  • Syntax
  • Output
Testing method

For testing/measuring, I wrote a couple of functions. The first is a function named Test-Performance. It returns PSObject with all of our test data that we can use to generate visualizations. The second is a simple function that takes the mean or median results from two sets, compares them, and returns a winner along with how much faster it was. The functions:

function Test-Performance {
    [CmdletBinding()]
    Param(
        [Parameter(Mandatory=$true,Position=1)]
        [ValidateRange(5,50000)]
        [int]$Count,
        [Parameter(Mandatory=$true,Position=2)]
        [ScriptBlock]$ScriptBlock
    )
    $Private:Occurrence = [System.Collections.Generic.List[Double]]::new()
    $Private:Sorted = [System.Collections.Generic.List[Double]]::new()
    $Private:ScriptBlockOutput = [System.Collections.Generic.List[string]]::new()
    [Double]$Private:Sum = 0
    [Double]$Private:Mean = 0
    [Double]$Private:Median = 0
    [Double]$Private:Minimum = 0
    [Double]$Private:Maximum = 0
    [Double]$Private:Range = 0
    [Double]$Private:Variance = 0
    [Double]$Private:StdDeviation = 0
    $Private:ReturnObject = '' | Select-Object Occurrence,Sorted,Sum,Mean,Median,Minimum,Maximum,Range,Variance,StdDeviation,Output

    #Gather Results
    for ($i = 0; $i -lt $Count; $i++) {
        $Timer = [System.Diagnostics.Stopwatch]::StartNew()
        #$Private:Output = Invoke-Command -ScriptBlock $ScriptBlock
        $Private:Output = $ScriptBlock.Invoke()
        $Timer.Stop()
        $Private:Result = $Timer.Elapsed
        $Private:Sum += $Private:Result.TotalMilliseconds
        [void]$Private:ScriptBlockOutput.Add($Private:Output)
        [void]$Private:Occurrence.Add($Private:Result.TotalMilliseconds)
        [void]$Private:Sorted.Add($Private:Result.TotalMilliseconds)
    }
    $Private:ReturnObject.Sum = $Private:Sum
    $Private:ReturnObject.Occurrence = $Private:Occurrence
    if (($Private:ScriptBlockOutput -notcontains "true") -and ($Private:ScriptBlockOutput -notcontains "false") -and ($Private:ScriptBlockOutput -notcontains $null)) {
        $Private:ReturnObject.Output = $Private:ScriptBlockOutput
    } else {
        $Private:ReturnObject.Output = $null
    }
    #Sort
    $Private:Sorted.Sort()
    $Private:ReturnObject.Sorted = $Private:Sorted

    #Statistical Calculations
    #Mean (Average)
    $Private:Mean = $Private:Sum / $Count
    $Private:ReturnObject.Mean = $Private:Mean

    #Median
    if (($Count % 2) -eq 1) {
        $Private:Median = $Private:Sorted[([Math]::Ceiling($Count / 2))]
    } else {
        $Private:Middle = $Count / 2
        $Private:Median = (($Private:Sorted[$Private:Middle]) + ($Private:Sorted[$Private:Middle + 1])) / 2
    }
    $Private:ReturnObject.Median = $Private:Median

    #Minimum
    $Private:Minimum = $Private:Sorted[0]
    $Private:ReturnObject.Minimum = $Private:Minimum

    #Maximum
    $Private:Maximum = $Private:Sorted[$Count - 1]
    $Private:ReturnObject.Maximum = $Private:Maximum

    #Range
    $Private:Range = $Private:Maximum - $Private:Minimum
    $Private:ReturnObject.Range = $Private:Range

    #Variance
    for ($i = 0; $i -lt $Count; $i++) {
        $x = ($Private:Sorted[$i] - $Private:Mean)
        $Private:Variance += ($x * $x)
    }
    $Private:Variance = $Private:Variance / $Count
    $Private:ReturnObject.Variance = $Private:Variance

    #Standard Deviation
    $Private:StdDeviation = [Math]::Sqrt($Private:Variance)
    $Private:ReturnObject.StdDeviation = $Private:StdDeviation
    
    return $Private:ReturnObject
}
Function Get-Winner {
    [CmdletBinding()]
    Param(
        [Parameter(Mandatory=$true,Position=1)]
        [ValidateNotNullOrEmpty()]
        [string]$AName,
        [Parameter(Mandatory=$true,Position=2)]
        [ValidateNotNullOrEmpty()]
        [Double]$AValue,
        [Parameter(Mandatory=$true,Position=3)]
        [ValidateNotNullOrEmpty()]
        [string]$BName,
        [Parameter(Mandatory=$true,Position=4)]
        [ValidateNotNullOrEmpty()]
        [Double]$BValue
    )
    if ($ClearBetweenTests) {
        Clear-Host
    }

    $blen = $AName.Length + $BName.Length + 12
    $Border = ''
    for ($i = 0; $i -lt $blen; $i++) {
        $Border += '*'
    }

    if ($OutToFile) {
        Out-File -FilePath $OutFileName -Append -Encoding utf8 -InputObject $Border
        Out-File -FilePath $OutFileName -Append -Encoding utf8 -InputObject ([string]::Format('**  {0} vs {1}  **', $AName, $BName))
        Out-File -FilePath $OutFileName -Append -Encoding utf8 -InputObject $Border
    }
    Write-Host $Border -ForegroundColor White
    Write-Host ([string]::Format('**  {0} vs {1}  **', $AName, $BName)) -ForegroundColor White
    Write-Host $Border -ForegroundColor White

    if ($AValue -lt $BValue) {
        $Faster = $BValue / $AValue
        if ($Faster -lt 1.05) {
            $Winner = 'Tie'
            $AColor = [ConsoleColor]::White
            $BColor = [ConsoleColor]::White
        } else {
            $Winner = $AName
            $AColor = [ConsoleColor]::Green
            $BColor = [ConsoleColor]::Red
        }
    } elseif ($AValue -gt $BValue) {
        $Faster = $AValue / $BValue
        if ($Faster -lt 1.05) {
            $Winner = 'Tie'
            $AColor = [ConsoleColor]::White
            $BColor = [ConsoleColor]::White
        } else {
            $Winner = $BName
            $AColor = [ConsoleColor]::Red
            $BColor = [ConsoleColor]::Green
        }
    } else {
        $Winner = 'Tie'
        $AColor = [ConsoleColor]::White
        $BColor = [ConsoleColor]::White
        $Faster = 0
    }
    
    $APad = ''
    $BPad = ''
    if ($AName.Length -gt $BName.Length) {
        $LenDiff = $AName.Length - $BName.Length
        for ($i = 0; $i -lt $LenDiff; $i++) {
            $BPad += ' '
        }
    } else {
        $LenDiff = $BName.Length - $AName.Length
        for ($i = 0; $i -lt $LenDiff; $i++) {
            $APad += ' '
        }
    }

    $AValue = [Math]::Round($AValue, 2)
    $BValue = [Math]::Round($BValue, 2)
    $Faster = [Math]::Round($Faster, 2)
    
    if ($OutToFile) {
        Out-File -FilePath $OutFileName -Append -Encoding utf8 -InputObject ([string]::Format('{0}:  {1}{2}ms', $AName, $APad, $AValue))
        Out-File -FilePath $OutFileName -Append -Encoding utf8 -InputObject ([string]::Format('{0}:  {1}{2}ms', $BName, $BPad, $BValue))
        Out-File -FilePath $OutFileName -Append -Encoding utf8 -InputObject ([string]::Format('WINNER: {0} {1}x Faster`r`n', $Winner, $Faster))
    }
    Write-Host ([string]::Format('{0}:  {1}{2}ms', $AName, $APad, $AValue)) -ForegroundColor $AColor
    Write-Host ([string]::Format('{0}:  {1}{2}ms', $BName, $BPad, $BValue)) -ForegroundColor $BColor
    Write-Host ([string]::Format('WINNER: {0} {1}x Faster', $Winner, $Faster)) -ForegroundColor Yellow
    if ($PauseBetweenTests -eq $true) {
        Pause
    }
}

Now, you may be wondering why I went through all of that trouble when there is a perfectly good Measure-Command cmdlet available. The reason is two fold. One, I wanted the statistics to be calculated without having to call a separate function. Two, Measure-Command does not handle output, and I wanted to be able to test and capture output if needed. If you haven’t tried to use Write-Output withing a Measure-Command script block before let me show you what I’m talking about:

PS C:> Measure-Command {Write-Host "Write-Host"}
Write-Host


Days              : 0
Hours             : 0
Minutes           : 0
Seconds           : 0
Milliseconds      : 12
Ticks             : 128366
TotalDays         : 1.48571759259259E-07
TotalHours        : 3.56572222222222E-06
TotalMinutes      : 0.000213943333333333
TotalSeconds      : 0.0128366
TotalMilliseconds : 12.8366


PS C:> Measure-Command {Write-Output "Write-Output"}                                                  

Days              : 0
Hours             : 0
Minutes           : 0
Seconds           : 0
Milliseconds      : 0
Ticks             : 4005
TotalDays         : 4.63541666666667E-09
TotalHours        : 1.1125E-07
TotalMinutes      : 6.675E-06
TotalSeconds      : 0.0004005
TotalMilliseconds : 0.4005

Notice that when we call Write-Output that we don’t see the output? With my Test-Performance function, we can grab that output and still capture it. The output from the two functions looks like this:

 Occurrance   : {4.0353, 1.0091, 0, 0…}
 Sorted       : {0, 0, 0, 1.0091…}
 Sum          : 5.0444
 Mean         : 1.00888
 Median       : 1.0091
 Minimum      : 0
 Maximum      : 4.0353
 Range        : 4.0353
 Variance     : 2.4425469256
 StdDeviation : 1.56286497356618
 Output       : {Write-Output, Write-Output, Write-Output, Write-Output…}

 ******************************
 **  Filter vs Where-Object  **
 ******************************
 Filter:        22ms
 Where-Object:  1007.69393ms
 WINNER: Filter 45.80x Faster

One other thing to mention is that I did not simply use $Start = Get-Date, $Stop = (Get-Date)-$Start. Why? Because some things happen so fast that I need to measure the speed in ticks or microseconds. Get-Date only measures time down to the millisecond, so anything less than a millisecond will be rounded to either 0 or 1 millisecond.

Test Order

With that out of the way, let’s look at test order first. Test Order is the order in which conditions are evaluated within a flow control block such as if/then or do/while. The compiler or engine will evaluate the conditions from left to right while respecting the order of operations. Why is this important? Let’s say you have the following if statement:

if (($haystack -contains "needle") -and ($x -eq 5)) {
    Do-Stuff
}

We have two conditions: Does $Haystack contain the string “needle” and does $x equal 5. With the and statement we tell the engine that both must be true to meet the conditions of the if statement. The engine will evaluate the first statement, and if true, will continue through the remaining statements until it reaches either a false statement or has evaluated all statements. Let’s take a quick look at how long it takes to evaluate a few different types of conditions.

$v = 5000
$a = 1..10000
$s = 'reg.exe'
$as = (Get-ChildItem -Path C:\Windows\System32 -Filter '*.exe').Name

Test-Performance -Count 100 -ScriptBlock {$v -eq 5000}
Test-Performance -Count 100 -ScriptBlock {$a -contains 5000}
Test-Performance -Count 100 -ScriptBlock {$s -eq 'reg.exe'}
Test-Performance -Count 100 -ScriptBlock {$as -contains 'reg.exe'}

That gives me the following output:

 Occurrence   : {0.9741, 0, 0, 5.9834…}
 Sorted       : {0, 0, 0, 0…}
 Sum          : 40.8437
 Mean         : 0.408437
 Median       : 0
 Minimum      : 0
 Maximum      : 5.9834
 Range        : 5.9834
 Variance     : 0.538503541531
 StdDeviation : 0.733828005414757
 Output       :

 Occurrence   : {0.9977, 0.9969, 0, 0.9971…}
 Sorted       : {0, 0, 0, 0…}
 Sum          : 67.7895
 Mean         : 0.677895
 Median       : 0.9934
 Minimum      : 0
 Maximum      : 3.9467
 Range        : 3.9467
 Variance     : 0.450743557675
 StdDeviation : 0.671374379668304
 Output       :

 Occurrence   : {0.989, 0.9973, 0, 0…}
 Sorted       : {0, 0, 0, 0…}
 Sum          : 52.9174
 Mean         : 0.529174
 Median       : 0
 Minimum      : 0
 Maximum      : 8.9804
 Range        : 8.9804
 Variance     : 1.222762781524
 StdDeviation : 1.10578604690238
 Output       :

 Occurrence   : {0.997, 0, 0, 1.0292…}
 Sorted       : {0, 0, 0, 0…}
 Sum          : 74.7425
 Mean         : 0.747425
 Median       : 0.957
 Minimum      : 0
 Maximum      : 6.9484
 Range        : 6.9484
 Variance     : 1.391867727275
 StdDeviation : 1.1797744391514
 Output       :

What we see is that comparing if something is equal to something else is a lot faster than checking to see if an array contains an object. Now, I know, you’re thinking it’s just a couple milliseconds, but, checking if $v is equal to 5000 is almost twice as fast as checking if $as contains “reg.exe”. Keep in mind, that depending on where in the array our match is and how big our array is, that number can go up or down quite a bit. I’m just doing some simple synthetic tests to illustrate that there is a difference. When doing conditional statements like this, try to have your quicker conditions evaluated first and try to have statements that are most likely to fail evaluated first. Example:

Test-Performance -Count 100 -ScriptBlock {
    if (($x -eq 100) -or ($a -contains -5090) -or ($s -eq 'test.fake') -or ($as -contains 'reg.exe')) {
        $t = Get-Random
    }
}

Test-Performance -Count 100 -ScriptBlock {
    if (($as -contains 'reg.exe') -or ($x -eq 100) -or ($a -contains -5090) -or ($s -eq 'test.fake')) {
        $t = Get-Random
    }
}

Gives me the following:

Occurrence   : {0.9858, 0, 0.9969, 0…}
 Sorted       : {0, 0, 0, 0…}
 Sum          : 36.8537
 Mean         : 0.368537
 Median       : 0
 Minimum      : 0
 Maximum      : 3.9959
 Range        : 3.9959
 Variance     : 0.390509577731
 StdDeviation : 0.624907655362774
 Output       :

 Occurrence   : {0.9974, 0, 0.9971, 0…}
 Sorted       : {0, 0, 0, 0…}
 Sum          : 54.8193
 Mean         : 0.548193
 Median       : 0.4869
 Minimum      : 0
 Maximum      : 3.9911
 Range        : 3.9911
 Variance     : 0.425326705251
 StdDeviation : 0.652170763873236
 Output       :

We can see that by changing the order of the evaluated conditions, our code runs in about 2/3 the time. Again, these are generic tests to illustrate the effect that test order has on execution time, but they illustrate some basic guidelines that should be able to be applied to most situations. Be sure to test your code.

Loop Execution

Now that I’ve gotten test order out of the way, let’s start with loop execution. Sometimes when we are working with a loop, like say stepping through an array, we don’t need to do something for every element. Sometimes, we are looking for a specific element and don’t care about anything after that. In these cases, break is our friend. For our first example, I’ll create an array of all years in the 1900’s. I’ll then loop through each one and write some output when I find 1950.

$Decade = 1900..1999
$TargetYear = 1950

$NoBreakResult = Test-Performance -Count 10 -ScriptBlock {
    for ($i = 0; $i -lt $Decade.Count; $i++) {
        if ($Decade[$i] -eq 1950) {
            Write-Output "Found 1950"
        }
    }
}

$BreakResult = Test-Performance -Count 10 -ScriptBlock {
    for ($i = 0; $i -lt $Decade.Count; $i++) {
        if ($Decade[$i] -eq 1950) {
            Write-Output "Found 1950"
            break
        }
    }
}

Get-Winner "No Break" $NoBreakResult.Median "Break" $BreakResult.Median

Our output looks as follows:

 ************************* 
 **  No Break vs Break  **
 *************************
 No Break:  0.38ms
 Break:     0.28ms
 WINNER: Break 1.35x Faster

$NoBreakResult
 Occurrence   : {0.8392, 0.4704, 0.4566, 0.444…}
 Sorted       : {0.3425, 0.3438, 0.3442, 0.3445…}
 Sum          : 47.8028
 Mean         : 0.478028
 Median       : 0.38175
 Minimum      : 0.3425
 Maximum      : 2.6032
 Range        : 2.2607
 Variance     : 0.127489637016
 StdDeviation : 0.357056910052165
 Output       : {Found 1950, Found 1950, Found 1950, Found 1950…}

$BreakResult
 Occurrence   : {3.2739, 0.3445, 0.32, 0.3167…}
 Sorted       : {0.2657, 0.266, 0.266, 0.2662…}
 Sum          : 40.0342
 Mean         : 0.400342
 Median       : 0.2871
 Minimum      : 0.2657
 Maximum      : 3.2739
 Range        : 3.0082
 Variance     : 0.182262889036
 StdDeviation : 0.426922579674582
 Output       : {Found 1950, Found 1950, Found 1950, Found 1950…}

As expected, the instance with the break commandwas about 25% faster. Next I’ll take a look at a different method that I don’t see in too many peoples code, the While/Do-While loop.

$DoWhileResult = Test-Performance -Count 100 -ScriptBlock {
    $i = 0
    $Year = 0
    do {
        $Year = $Decade[$i]
        if ($Year -eq 1950) {
            Write-Output "Found 1950"
        }
        $i++
    } While ($Year -ne 1950)
}

Which nets me the following:

 ****************************
 **  Do-While vs No Break  **
 ****************************
 Do-While:  0.24ms
 No Break:  0.38ms
 WINNER: Do-While 1.57x Faster

$DoWhileResult
 Occurrence   : {0.9196, 0.313, 0.2975, 0.2933…}
 Sorted       : {0.2239, 0.224, 0.2242, 0.2243…}
 Sum          : 33.8217
 Mean         : 0.338217
 Median       : 0.2436
 Minimum      : 0.2239
 Maximum      : 5.0187
 Range        : 4.7948
 Variance     : 0.262452974211
 StdDeviation : 0.512301643771519
 Output       : {Found 1950, Found 1950, Found 1950, Found 1950…}

As we can see, Do-While is also faster than running through the entire array. My example above does not have any safety mechanism for running beyond the end of the array or not finding the element I’m searching for. In practice, be sure to include such a condition/catch in your loop. Next, I’m going to compare the performance between a few different types of loops. Each loop will run through an array of numbers from 1 to 10,000 and calculate the square root of each. I’ll use the basic for loop as the baseline to compare against the other methods.

$ForLoop = Test-Performance -Count 100 -ScriptBlock {
    $ForArray = 1..10000
    for ($i = 0; $i -lt 10000; $i++) {
        $sqrt = [Math]::Sqrt($Array[$i])
    }
}

$ForEachLoop = Test-Performance -Count 100 -ScriptBlock {
    $ForEachArray = 1..10000
    foreach ($item in $ForEachArray) {
        $sqrt = [Math]::Sqrt($item)
    }
}

$DotForEachLoop = Test-Performance -Count 100 -ScriptBlock {
    $DotForEachArray = 1..10000
    $DotForEachArray.ForEach{
        $sqrt = [Math]::Sqrt($_)
    }
}

$ForEachObjectLoop = Test-Performance -Count 100 -ScriptBlock {
    $ForEachObjectArray = 1..10000
    $ForEachObjectArray | ForEach-Object {
        $sqrt = [Math]::Sqrt($_)
    }
}

So how do they fare?

 ***********************
 **  For vs For-Each  **
 ***********************
 For:       3ms
 For-Each:  1.99355ms
 WINNER: For-Each 1.50x Faster
 
 ***********************
 **  For vs .ForEach  **
 ***********************
 For:       3ms
 .ForEach:  1150.95495ms
 WINNER: For 383.65x Faster
 
 *****************************
 **  For vs ForEach-Object  **
 *****************************
 For:             3ms
 ForEach-Object:  1210.7644ms
 WINNER: For 403.59x Faster

Quite a bit of difference. Let’s take a look at the statistics for each of them.

$ForLoop
 Occurrence   : {38.8952, 3.9984, 2.9752, 2.966…}
 Sorted       : {0, 0, 1.069, 1.9598…}
 Sum          : 330.7618
 Mean         : 3.307618
 Median       : 2.9731
 Minimum      : 0
 Maximum      : 38.8952
 Range        : 38.8952
 Variance     : 26.100085284676
 StdDeviation : 5.10882425658546
 Output       :

$ForEachLoop
 Occurrence   : {7.0133, 1.9972, 1.9897, 0.9678…}
 Sorted       : {0.9637, 0.9678, 0.9927, 0.9941…}
 Sum          : 187.5277
 Mean         : 1.875277
 Median       : 1.99355
 Minimum      : 0.9637
 Maximum      : 7.0133
 Range        : 6.0496
 Variance     : 0.665303603371
 StdDeviation : 0.815661451443551
 Output       :

$DotForEachLoop
 Occurrence   : {1225.7258, 1169.9073, 1147.9007, 1146.9384…}
 Sorted       : {1110.0618, 1110.0688, 1113.9906, 1114.0656…}
 Sum          : 114948.9291
 Mean         : 1149.489291
 Median       : 1150.95495
 Minimum      : 1110.0618
 Maximum      : 1225.7258
 Range        : 115.664
 Variance     : 534.931646184819
 StdDeviation : 23.1285893686757
 Output       :

$ForEachObjectLoop
 Occurrence   : {1217.7802, 1241.7037, 1220.686, 1249.688…}
 Sorted       : {1181.8081, 1188.8231, 1188.8291, 1191.7818…}
 Sum          : 121345.8078
 Mean         : 1213.458078
 Median       : 1210.7644
 Minimum      : 1181.8081
 Maximum      : 1274.6289
 Range        : 92.8208000000002
 Variance     : 318.356594303116
 StdDeviation : 17.8425501065043
 Output       :

If you notice on the for and for-each loops, the first run is significantly higher than the other entries (in fact, it’s the slowest run in the batch for each) whereas the method and cmdlet versions are much more consistent. This is due to the behavior of those methods. With a for and for-each loop, the method loads the entire collection into memory before processing. This causes the first run of the loop to take a bit longer, although, it’s still faster than the method or cmdlet. The cmdlet and method are slower as they load one iteration into memory at a time which is slower than loading the sum all at once (think random read/write vs sequential). The for loop is slightly slower than for-each because it has to evaluate the condition before proceeding through the next iteration.

.NET Methods vs. Cmdlets

Next, I’ll take a look at some of the differences between some of the common “native” PowerShell cmdlets and their .NET counterparts. I’m going to start with what will likely be the most common things that you’ll encounter in your scripts or scripts that you use, the array. We’ve probably all used them, and maybe even continue to use them. But should you? First, Let’s look at adding items to an array. We frequently start with blank arrays and add items to them as we go along.

$ArrayResult = Test-Performance -Count 100 -ScriptBlock {
    $Array = @()
    for ($i =0; $i -lt 10000; $i ++) {
        $Array += $i
    }
}

$ListResult = Test-Performance -Count 100 -ScriptBlock {
    $List = [System.Collections.Generic.List[PSObject]]::new()
    for ($i =0; $i -lt 10000; $i ++) {
        [void]$List.Add($i)
    }
}

Get-Winner "Array" $ArrayResult.Median "List" $ListResult.Median
 *********************
 **  Array vs List  **
 *********************
 Array:  2274ms
 List:   2.97945ms
 WINNER: List 763.23x Faster

$ArrayResult
 Occurrence   : {2407.5676, 2311.8239, 2420.5336, 2268.9383…}
 Sorted       : {2190.1917, 2200.1205, 2219.1807, 2223.0887…}
 Sum          : 228595.7729
 Mean         : 2285.957729
 Median       : 2274.42135
 Minimum      : 2190.1917
 Maximum      : 2482.3996
 Range        : 292.2079
 Variance     : 2527.01010551066
 StdDeviation : 50.2693754239165
 Output       :

$ListResult
 Occurrence   : {24.9343, 19.9729, 3.9623, 5.9836…}
 Sorted       : {0.9974, 1.9776, 1.9925, 1.994…}
 Sum          : 373.999
 Mean         : 3.73999
 Median       : 2.97945
 Minimum      : 0.9974
 Maximum      : 51.8617
 Range        : 50.8643
 Variance     : 37.0781465771
 StdDeviation : 6.0891827511662
 Output       :

Modifying an existing array can be a VERY expensive operation. Arrays are fixed length and can not be expanded or contracted. When we add or subtract an element, the engine first has to create a new array of size n + 1 or n – 1 and then copy each of the elements from the old array into the new one. This is slow, and can consume a lot of memory while the new array is being created and contents copied over. Lists on the other hand are not statically sized. The advantage of an array however is that they have a smaller memory footprint. Since an array is stored as a whole consecutively in memory, it’s size can roughly be calculated as SizeOf(TypeOf(Element))*NumElements. A Linked list on the other hand is not stored consecutively within memory and is a bit larger since each element contains a pointer to the next object. It’s size can roughly be calculated as (SizeOf(TypeOf(Element)) + SizeOf(Int)) * NumElements. You might be thinking, well, if an array is stored in a consecutive memory blocks, once the array is established, it should be faster to work with right? I’ll test.

[int[]]$Array = 1..10000
$List = [System.Collections.Generic.List[int]]::new()
for ($i = 1; $i -lt 10001; $i++) {
    [void]$List.Add($i)
}

$ArrayForEachResult = Test-Performance -Count 100 -ScriptBlock {
    foreach ($int in $Array) {
        $int = 5
    }
}

$ListForEachResult = Test-Performance -Count 100 -ScriptBlock {
    foreach ($int in $List) {
        $int = 5
    }
}

First, we create an array of 10,000 elements with the numbers 1 through 10,000 inclusive. We declare the array as an integer array to ensure we are comparing to objects of the same type so to speak. We then create a list<int> and fill with the same values. So how do they fare?

 ***************************************
 **  Array For-Each vs List For-Each  **
 ***************************************
 Array For-Each:  1.47ms
 List For-Each:   0.83ms
 WINNER: List For-Each 1.77x Faster

$ArrayForEachResult
 Occurrence   : {4.643, 1.4673, 1.4029, 1.3336…}
 Sorted       : {1.3194, 1.3197, 1.3255, 1.3272…}
 Sum          : 156.4036
 Mean         : 1.564036
 Median       : 1.47125
 Minimum      : 1.3194
 Maximum      : 4.643
 Range        : 3.3236
 Variance     : 0.136858367504
 StdDeviation : 0.369943735592319
 Output       : {, , , …}

$ListForEachResult
 Occurrence   : {7.233, 1.723, 0.8305, 0.8632…}
 Sorted       : {0.6174, 0.6199, 0.6203, 0.6214…}
 Sum          : 164.8467
 Mean         : 1.648467
 Median       : 0.83335
 Minimum      : 0.6174
 Maximum      : 71.705
 Range        : 71.0876
 Variance     : 50.017547074011
 StdDeviation : 7.07230846852787
 Output       : {, , , …}

As we can see, the list still out-performs the array, although by less of a margin than it did during the manipulation test. I suspect that this is due to the cmdlet having to load the entirety of the array as opposed to just pointers with the list. Now let’s compare .NET Regex vs the PowerShell method. For this, I’m going to be replacing text instead of just checking for the match. Let’s look at the code.

$Haystack = "The Quick Brown Fox Jumped Over the Lazy Dog 5 Times"
$Needle = "\ ([\d]{1})\ "

$NetRegexResult = Test-Performance -Count 1000 -ScriptBlock {
    [regex]::Replace($Haystack, $Needle, " $(Get-Random -Minimum 2 -Maximum 9) ")
    Write-Output $Haystack
}

$PoshRegexResult = Test-Performance -Count 1000 -ScriptBlock {
    $Haystack -replace $Needle, " $(Get-Random -Minimum 2 -Maximum 9) "
    Write-Output $Haystack
}

Get-Winner ".NET RegEx" $NetRegexResult.Median "PoSh RegEx" $PoshRegexResult.Median

Nothing too fancy here. We take our haystack (the sentence), look for the needle (the number of times the fox jumped over the dog) and replace it with a new single digit random number.

 ********************************
 **  .NET RegEx vs PoSh RegEx  **
 ********************************
 .NET RegEx:  0.23ms
 PoSh RegEx:  0.23ms
 WINNER: Tie 1x Faster

$NetRegexResult
 Occurrence   : {0.7531, 0.2886, 0.3572, 0.3181…}
 Sorted       : {0.2096, 0.2106, 0.211, 0.2189…}
 Sum          : 282.3331
 Mean         : 0.2823331
 Median       : 0.23035
 Minimum      : 0.2096
 Maximum      : 2.2704
 Range        : 2.0608
 Variance     : 0.03407226235439
 StdDeviation : 0.184586733961003
 Output       : {The Quick Brown Fox Jumped Over the Lazy Dog 5 Times The Quick Brown Fox Jumped Over the Lazy Dog 5 Times, The Quick Brown Fox Jumped Over the Lazy Dog 8 Times   
                The Quick Brown Fox Jumped Over the Lazy Dog 5 Times, The Quick Brown Fox Jumped Over the Lazy Dog 4 Times The Quick Brown Fox Jumped Over the Lazy Dog 5 Times,   
                The Quick Brown Fox Jumped Over the Lazy Dog 4 Times The Quick Brown Fox Jumped Over the Lazy Dog 5 Times…}

$PoshRegexResult
 Occurrence   : {0.7259, 0.2546, 0.2513, 0.2486…}
 Sorted       : {0.2208, 0.2209, 0.2209, 0.2211…}
 Sum          : 279.0913
 Mean         : 0.2790913
 Median       : 0.231
 Minimum      : 0.2208
 Maximum      : 2.1124
 Range        : 1.8916
 Variance     : 0.03001781767431
 StdDeviation : 0.173256508317321
 Output       : {The Quick Brown Fox Jumped Over the Lazy Dog 8 Times The Quick Brown Fox Jumped Over the Lazy Dog 5 Times, The Quick Brown Fox Jumped Over the Lazy Dog 6 Times   
                The Quick Brown Fox Jumped Over the Lazy Dog 5 Times, The Quick Brown Fox Jumped Over the Lazy Dog 7 Times The Quick Brown Fox Jumped Over the Lazy Dog 5 Times,   
                The Quick Brown Fox Jumped Over the Lazy Dog 2 Times The Quick Brown Fox Jumped Over the Lazy Dog 5 Times…}

Surprisingly, or not surprisingly, the two methods are pretty much dead even. This is one of the cases where I suspect the PowerShell cmdlet is pretty much just a wrapper/alias for the corresponding .NET equivalent. You might ask yourself why you would use the .NET methods if the PowerShell cmdlets net the same performance. The answer (and this applies in a lot of cases) is that the PowerShell Cmdlets don’t always offer the same options as their .NET counterparts. I’m going to use String.Split as an example. Take a look at the two documentation pages for “String” -Split and String.Split. You may have noticed that they aren’t entirely the same. Far from it actually. In most cases, they will return you with the same results, but they don’t both support the same options. For example, if you want to remove blank entries, you’ll need to use the .Split() method. But what about performance?

$SplitString = "one,two,three,four,five,six,seven,eight,nine,ten,"
$DashSplitResult = Test-Performance -Count 10000 -ScriptBlock {
    $SplitArray = $SplitString -Split ','
}

$DotSplitResult = Test-Performance -Count 10000 -ScriptBlock {
    $SplitArray = $SplitString.Split(',')
}

Get-Winner "-Split" $DashSplitResult.Median ".Split()" $DotSplitResult.Median
 **************************
 **  -Split vs .Split()  **
 **************************
 -Split:    0.13ms
 .Split():  0.12ms
 WINNER: .Split() 1.1x Faster

$DashSplitResult
 Occurrence   : {0.4855, 0.1837, 0.2387, 0.1916…}
 Sorted       : {0.1128, 0.113, 0.1131, 0.1131…}
 Sum          : 1613.99049999999
 Mean         : 0.161399049999999
 Median       : 0.125
 Minimum      : 0.1128
 Maximum      : 2.1112
 Range        : 1.9984
 Variance     : 0.0234987082460975
 StdDeviation : 0.153292883872988
 Output       : {, , , …}

$DotSplitResult
 Occurrence   : {0.552, 0.1339, 0.1245, 0.1227…}
 Sorted       : {0.1052, 0.1056, 0.1056, 0.1057…}
 Sum          : 1485.38330000001
 Mean         : 0.148538330000001
 Median       : 0.1162
 Minimum      : 0.1052
 Maximum      : 1.9226
 Range        : 1.8174
 Variance     : 0.0186857188798111
 StdDeviation : 0.136695716391594
 Output       : {, , , …}

Pretty close, but .Split does edge out -Split by just a hair. Is it worth re-writing all of your code? Doubtful. But if you use string splitting methods frequently, it may be worth doing some testing with your common use cases to see if there could be an impact. And with that, I’m going to wrap up the first part of this post.
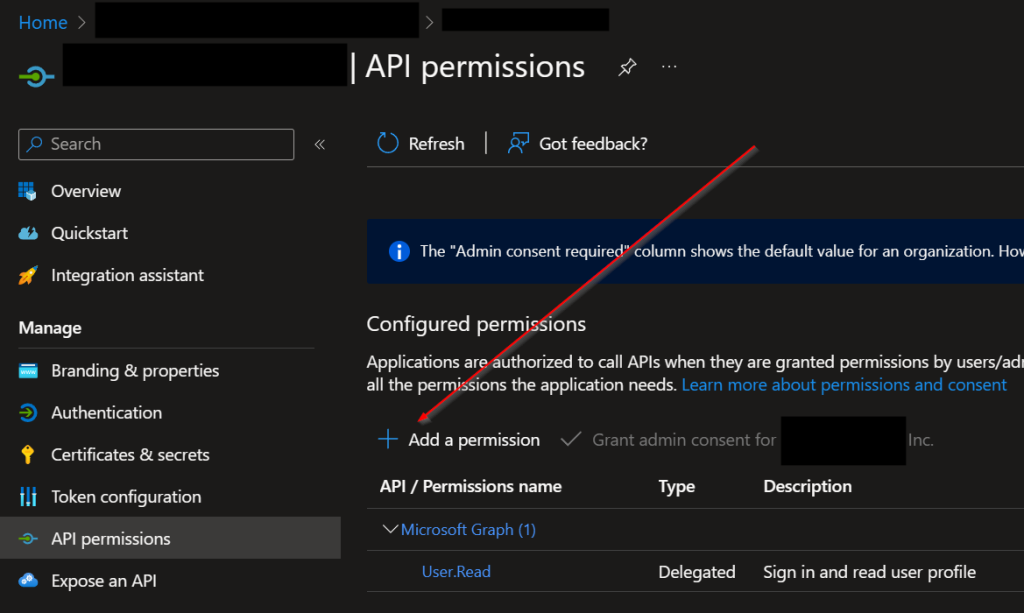
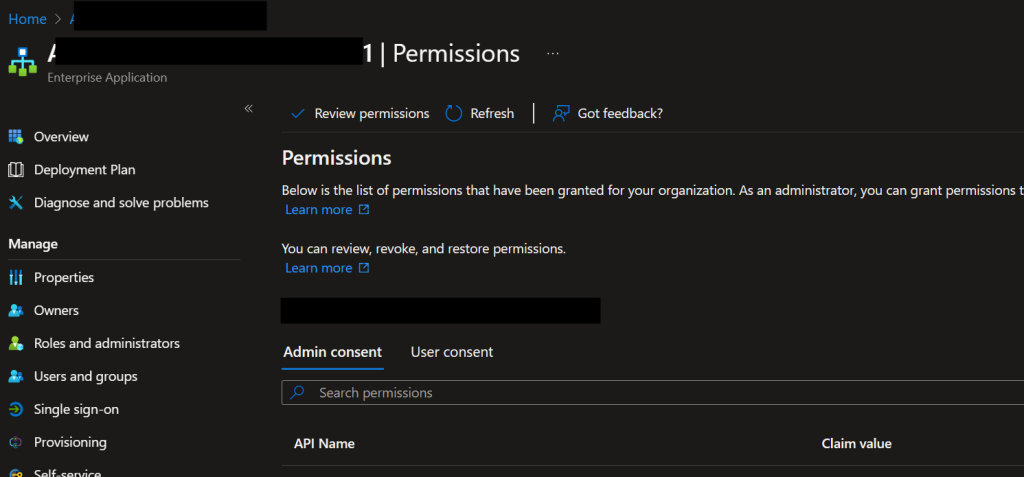
Sending TiltPi Data to Azure Log Analytics via PHP

I use a couple Tilt Hydrometers to track and log the fermentation data for my beers. While there are a few different ways that one can upload the data to the internet, I noticed that there wasn’t an automated way to upload to Azure Log Analytics. TiltPi is built on a customized variant of Raspbian. The current version utlizes Raspbian Stretch, which in turn is based on Debian Stretch. Microsoft supports Linux and has an OMS agent available for both x86 and x64 variants of Linux. They don’t, however, currently support the ARM platform which the Raspberry Pi boards are built on. Attempting to install the OMS Agent via the script from GitHub fails. While the agent is built on Ruby and Fluentd which are both compatable with ARM64, other components such as omi are not. If all you need is syslogs, there is a fluentd plugin for OMS which Microsoft supports. Unfortunately, the Tilt app does not write to the syslog. It writes to it’s own CSV formatted log. That leaves us with two options: write a daemon to forward new entries to syslog or utilize the cloudurl and write the data directly to Log Analytics using the REST API. The first sounded like more effort than I wanted to put into this project and would likely be purpose built for this and this alone. The second method though, sounded a bit easier, and more flexible. Thankfully, Microsoft has a nice bit of documentation regarding the HTTP Data Collector API on their docs website.
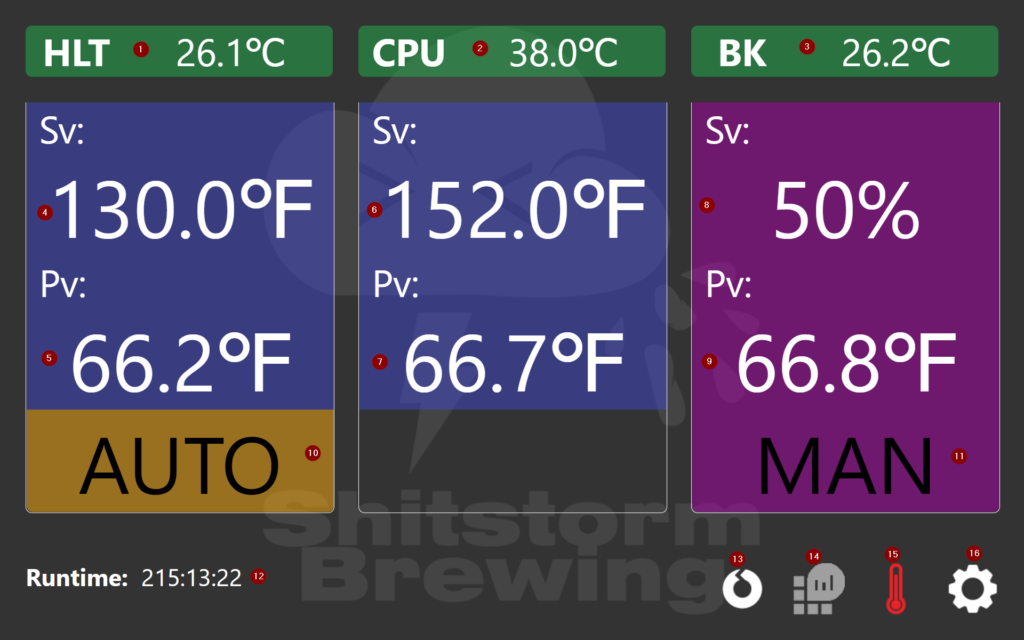
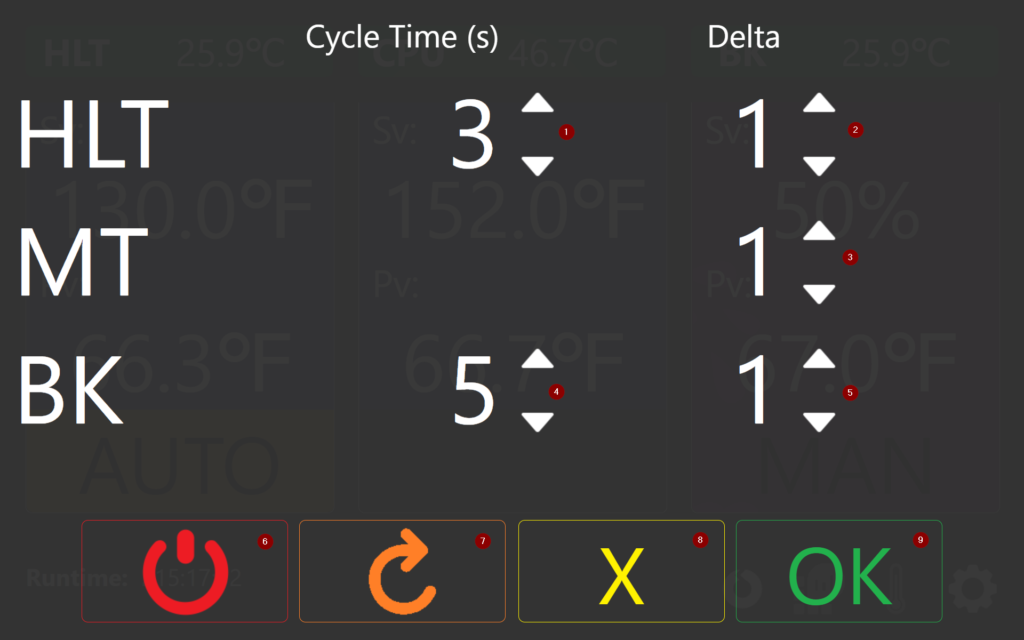
I was able to use this information to build a framework for writing data directly to Azure via a PHP script. Microsoft’s documentation thankfully has all the information we need.  The examples helped with some of the basic pieces that I needed to get going, however, I did have to do a bit of playing around to get the signature to work since translating from one language to another is not always straight forward.  .NET for example requires byte arrays when calling encode/decode/hash functions whereas PHP just wants the raw string.  When calling the API, part of the HTTP header is a Signature that authorizes you and tells Log Analytics where to put the data.  The basic formula is base64_encode(sha256_hmac(base64_decode(<SharedKey>), <HashData>)).  Let’s break that down.  First, we need to create our HashData.  This is a string formatted as follows:  <SendMethod>\n<PayloadLength>\n<ContentType>\nx-ms-date:<RFC1123Date>\n<SendResource>.  All of these are detailed in the documentation, but essentially we have “POST\n<PayloadLength>\napplication/json\nx-ms-date: <RFC1123Date>\n/api/logs” where <PayloadLength> is the length of our data we are going to send and <RFC1123Date> is the current date/time in RFC 1123 format.  Once we have that string, we need to ensure that it is encoded as utf8.  Once we have the utf8 encoded version of the string, we pass that to hash_hmac and have it create a sha256 hash using that and our base64 decoded key.  We then do a base64_encode on the resulting hash and create our signature; “SharedKey <WorkspaceID>:<EncodedHash>”.  After we have that, we can use the curl libraries to send the data to OMS.  The code for our function looks like this:
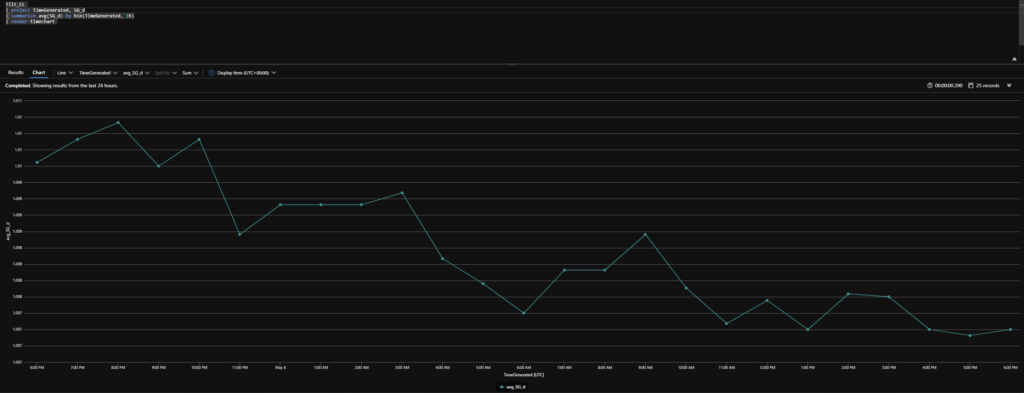
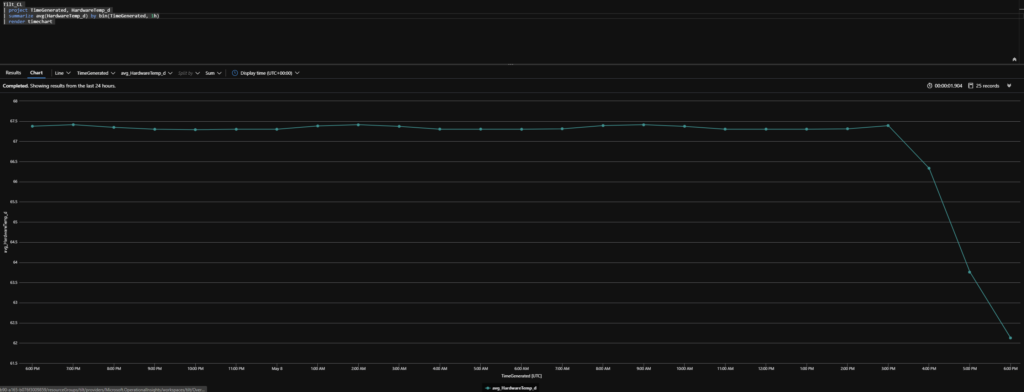
public function Send_Log_Analytics_Data($Payload) {
	#Get current timestamp (UTC) and Payload length
	$Rfc1123Date = gmdate('D, d M Y H:i:s T');
	$PayloadLength = strlen($Payload);
	
	#Generate the Signature
	$StringToSign = "{$this->SendMethod}\n{$PayloadLength}\n{$this->SendContentType}\nx-ms-date:{$Rfc1123Date}\n{$this->SendResource}";
	$Utf8String = utf8_encode($StringToSign);
	$Hash = hash_hmac('sha256', $Utf8String, base64_decode($this->PrimaryKey), true);
	$EncodedHash = base64_encode($Hash);
	$Signature = "SharedKey {$this->WorkspaceId}:{$EncodedHash}";
	
	#Build the URI and headers for cURL
	$Uri = "https://{$this->WorkspaceId}.ods.opinsights.azure.com{$this->SendResource}?api-version={$this->SendApiVersion}";
	$Handle = curl_init($Uri);
	$Headers = array("Authorization: {$Signature}", "Log-Type: {$this->LogType}", "x-ms-date: {$Rfc1123Date}", "time-generated-field: {$this->TimeStampField}", "Content-Type: {$this->SendContentType}");
	
	#Set cURL Options
	curl_setopt($Handle, CURLOPT_POST, true);
	curl_setopt($Handle, CURLOPT_HEADER, true) or die("Failed to set cURL Header");
	curl_setopt($Handle, CURLOPT_HTTPHEADER, $Headers) or die("Failed to set cURL Header");
	curl_setopt($Handle, CURLOPT_POSTFIELDS, $Payload);
	curl_setopt($Handle, CURLOPT_RETURNTRANSFER, true) or die("Failed to set cURL Return Transfer");
	
	#Execute cURL and return the result
	$Result = curl_exec($Handle);
	return curl_getinfo($Handle, CURLINFO_HTTP_CODE);
}

Now that we can send data, what data are we sending? The Tilt app sends the following pieces of information to whatever cloud url you specify in the logging tab:

  • Timepoint (Excel datetime value)
  • Temp (deg F)
  • SG (Specific Gravity)
  • Beer (Name of the Beer)
  • Color (Color of the Tilt)
  • Comment (blank unless you manually send data and add a comment)

We can take this post data and create our payload by converting it into a JSON formatted string.

$TimeStamp = gmdate('Y-m-d\TH:i:s.v\Z');
$Entry = "[{\"Timepoint\": \"{$TimeStamp}\", \"Temp\": {$Temp}, \"SG\": {$SG}, \"Beer\": \"{$Beer}\", \"Color\": \"{$Color}\", \"Comment\": \"{$Comment}\",\"Source\": \"TiltPHP\"}]";

Since we’re doing this in real time as data is sent, we are ignoring the timestamp that the Tilt app has created and instead using our own. This lets us skip having to convert the Excel formatted date into one that Log Analytics can use. If you need to use the Excel date, it’s just the number of days that have passed since 12:00AM 1900-01-01. The entry we created above is what we pass to the Send_Log_Analytics_Data as the $Payload parameter. And now, we can sit down, have a beer, and watch data flow into Log Analytics. If you’re interested in looking at the full code, I’ve posted it up on my GitHub space. Soon I’ll write something up on how to do something with that data 😉