
The Why?
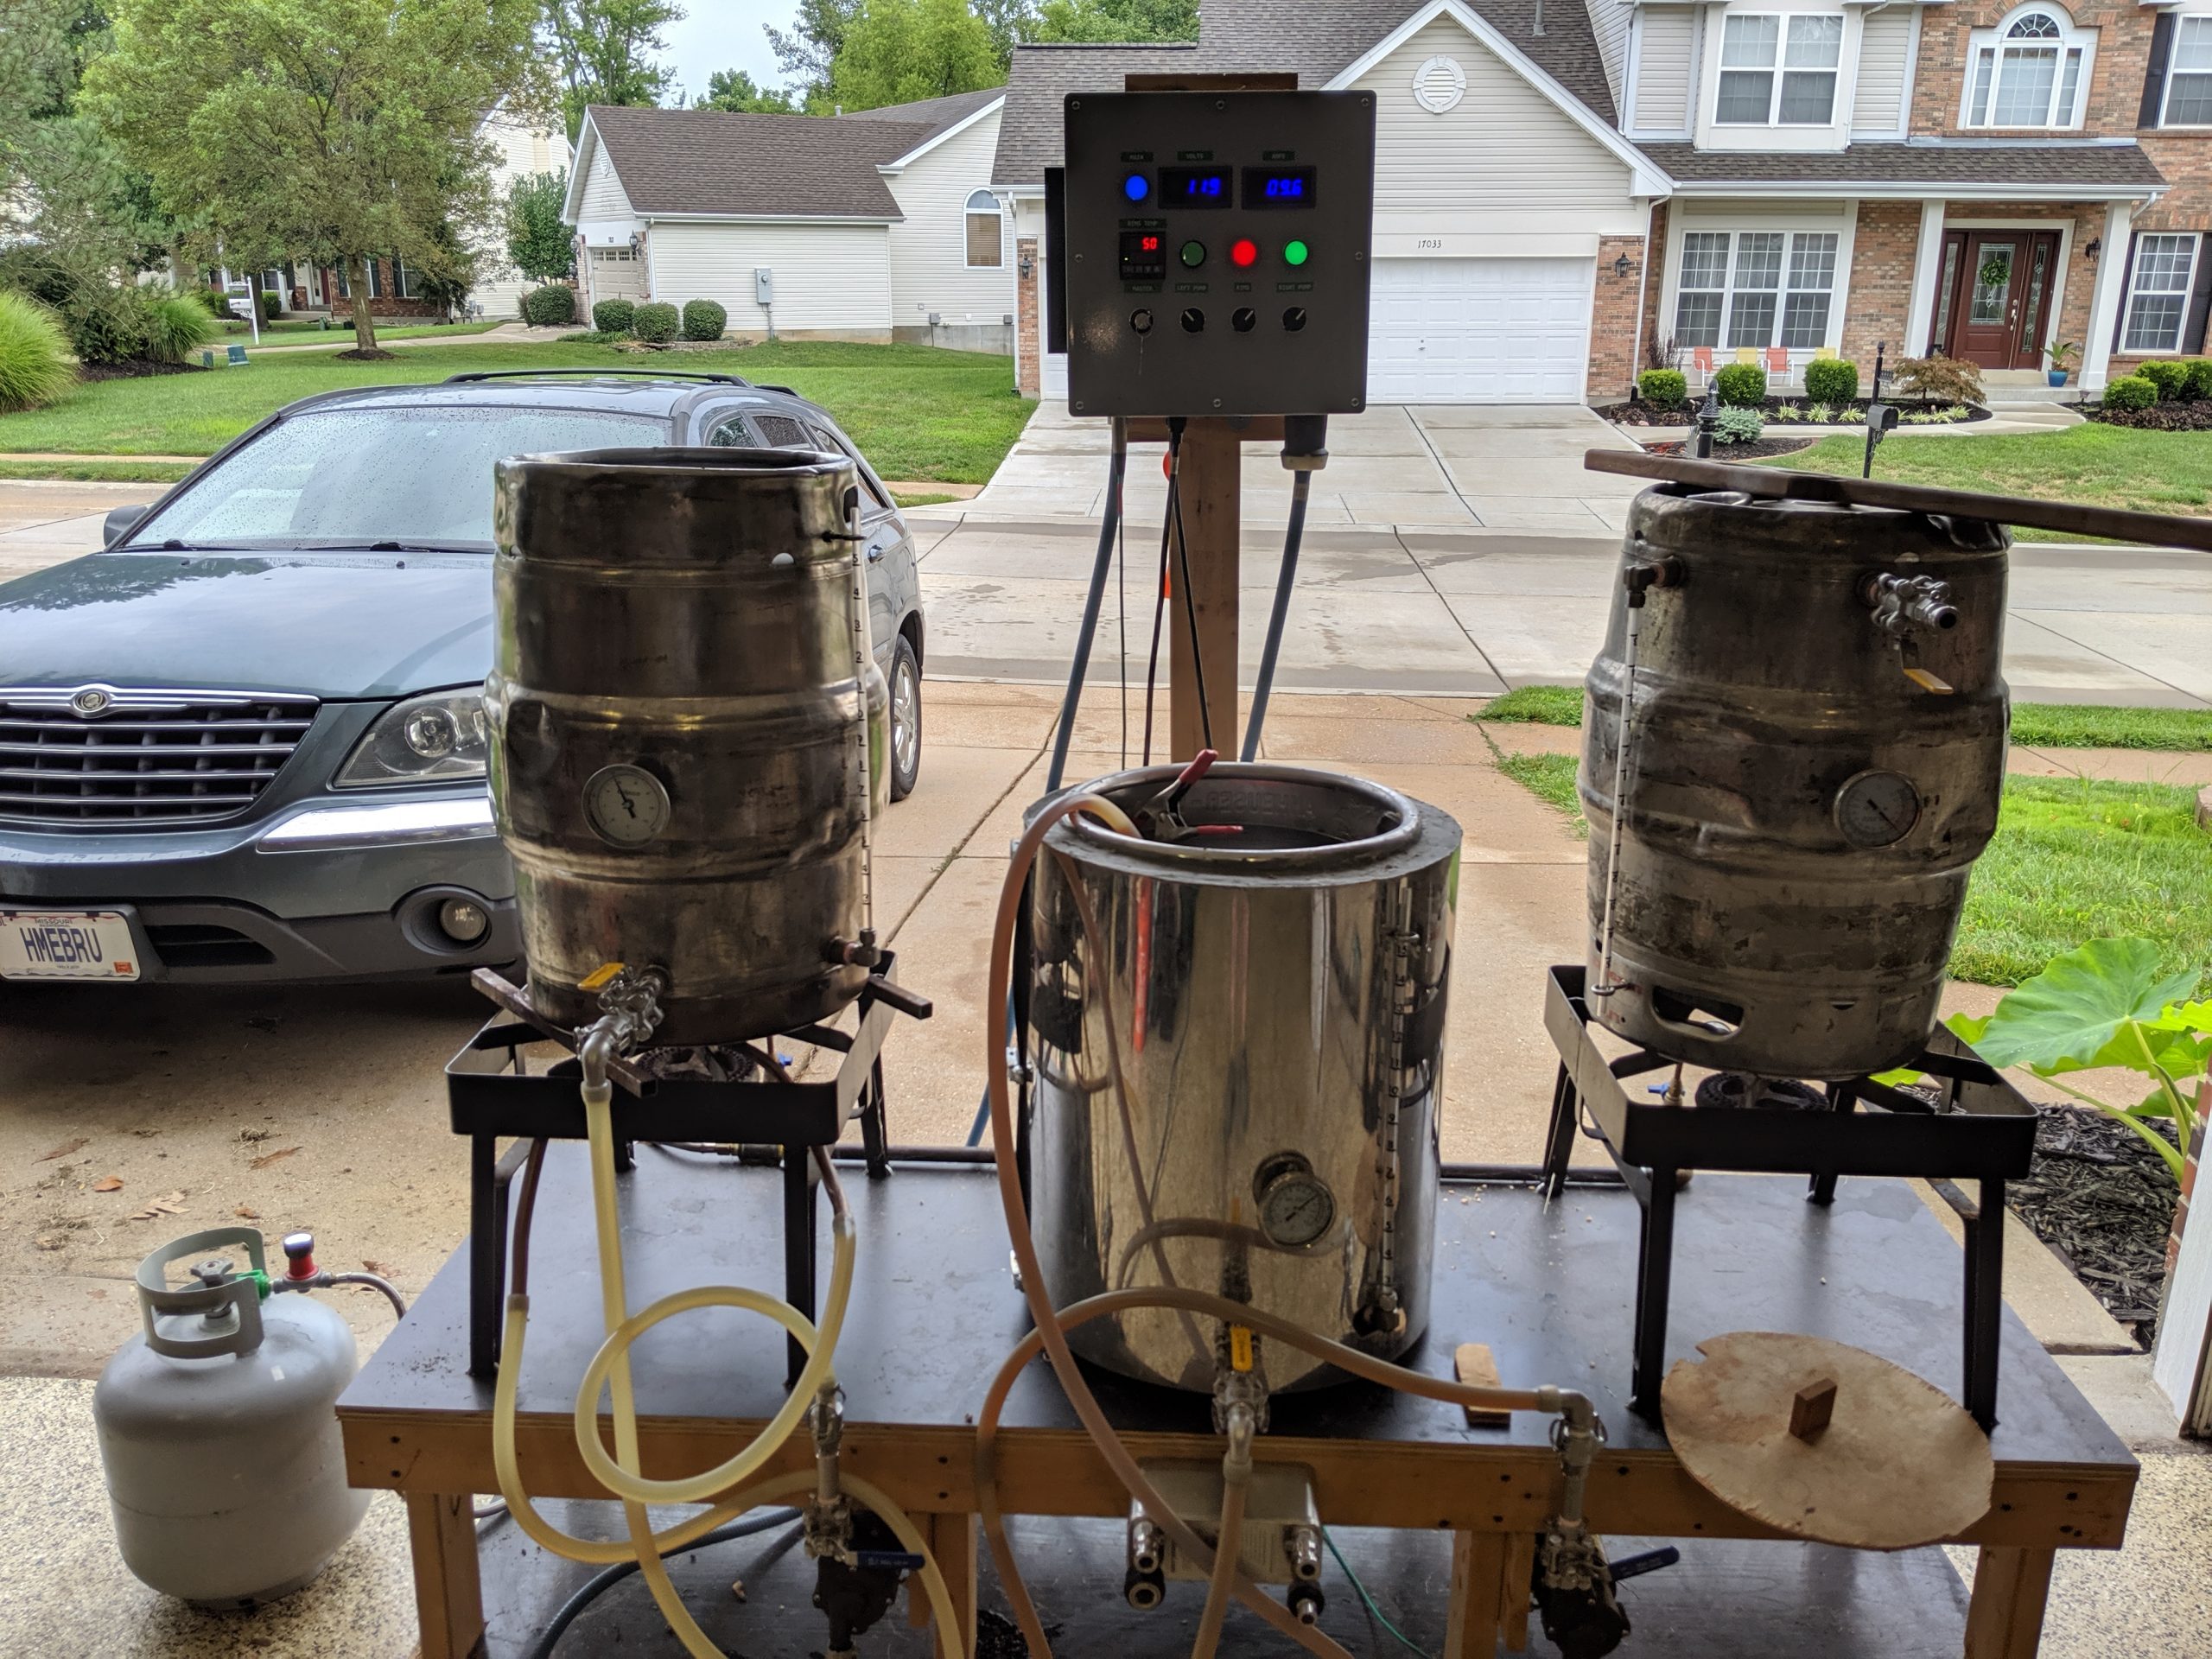
I’ve been home brewing for over 10 years. I got my start after helping a colleague brew on his system in his garage and jumped straight into an all-grain 3 vessel setup the next day. Well, not exactly the next day. It took me about a month to build my first system. I did what a lot of homebrewers do and used three 1/2 bbl kegs as brew pots with propane as the heat source. This system served me very well for those 10 years and is still fully functional today. But after 10 years of brewing in my garage, I decided it was finally time to upgrade some components, switch over to a fully electric setup, and brew in my basement where the temperature is 74℉ year round thanks to the server rack that sits in the corner. I’ve gone back and forth over the years leading up to the build as to whether or not to use a PLC of some sort, or a simple PID controlled setup. I really liked the simplicity of the PID controllers, however, the prospect of flexibility and future upgrade-ability eventually won me over and I decided to go with a Raspberry Pi powered solution. Since there are tons of articles around the net detailing how to build a panel, I’ll just touch on some of the bits without going into super detail on every aspect and instead focus on the Raspberry Pi and the code that runs everything.
Build Objectives
For the build, there were a few things that I wanted:
- Full stainless
- Sanitary Fittings (Tri-Clover)
- DIN Rail mounted components
- 1/2 bbl (15 gal) batch size
- Ability to run both HLT and BK at the same time
Hardware
I’ve included a full build sheet at the bottom of this article that includes places that I purchased items from and prices. The main difference between this panel, and a PID controlled one comes down to just four components:
- Raspberry Pi
- Touchscreen
- Hats (expansion boards)
- Power Supplies
For the Raspberry Pi, I went with the 4GB model 4B. I figured that the additional memory couldn’t hurt, and since everything is part of the board, the only way to upgrade down the road is to completely replace the Pi. I also opted to go with a larger touchscreen than what I used for my Fermentation Controller build. Instead of the 7″, I chose a 10″ screen to allow for an easier to read (and control) interface. We will also need a 5v and 12v power supply to power the Pi and touchscreen.
For the hats, I opted to utilise the DAQC2plate and THERMOplate from Pi-Plates. With the fermentation controller build, I simply used a DAQCplate to do both the control and temperature measurement. One key difference between the DAQCplate and THERMOplate is that the DAQCplate does the temperature readings when you ask for them (which take about a second each), as opposed to the THERMOplate which does them in the background and then just returns the last read value when you request it. For a fermentation controller, waiting one second for each temperature measurement is no big deal as we aren’t making changes rapidly or drastically. For the brewing process, we need something a bit more responsive.
Layout

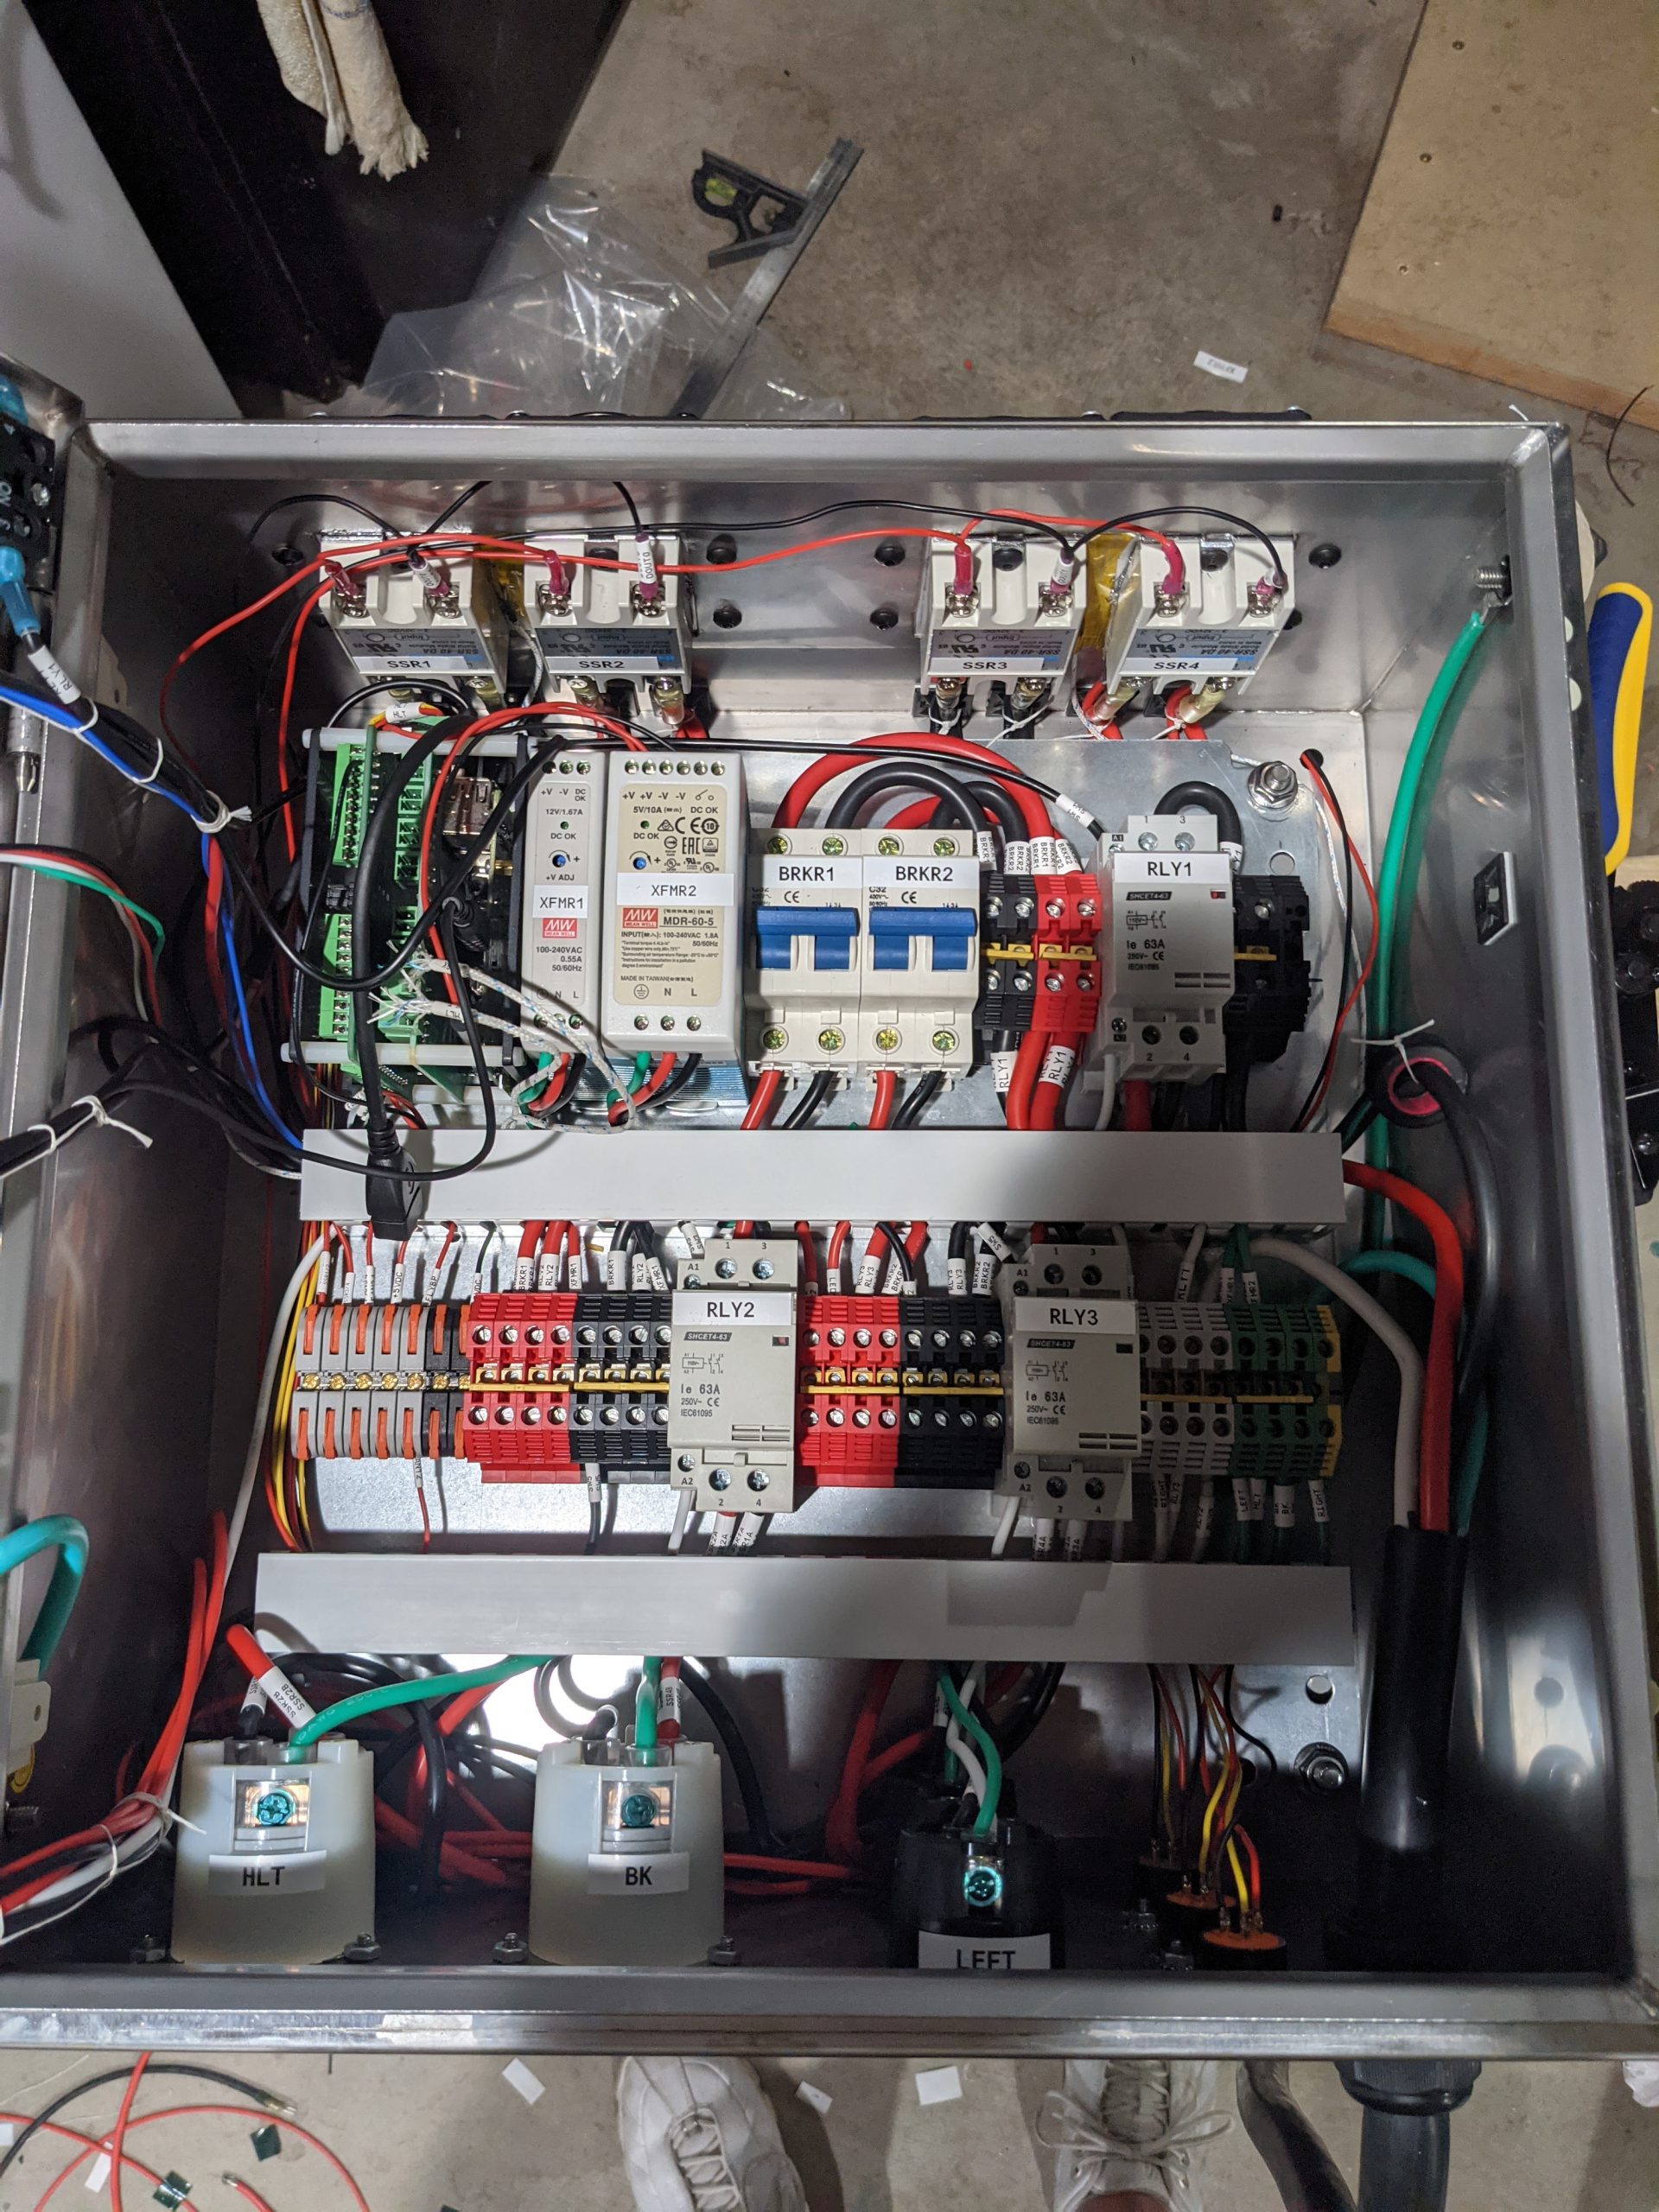
I wanted to keep the inside of my panel as tidy as possible. The DIN rails and cable raceways helped with that tremendously. The input is a 50A circuit which comes into a DPST relay (RLY1). From there, it is split to two 32A breakers (BRKR1 & 2) to ensure that a single element can’t pull more than that and to reduce down-stream wiring requirements. Each breaker feeds into a bank of terminal blocks to distribute the current to the various components on each leg. All of the 110v components (Relay coils and pumps) run off of a single breaker and phase. Two other relays (RLY2/3) are controlled via switches on the front panel to over-ride power to the heating elements. The transformers at the top power the Raspberry Pi, Pi-Plates, and Touchscreen.
Code
There are three parts to the code. The UI, the controller, and finally, the log writer. The UI is a fairly simple webpage. It makes use of css for the layout, and javascript to update the elements. PHP powers the back end to generate the responses for the AJAX calls. The controller is a python script which monitors the temperature of various components, controls the SSRs and heatsink fans, and writes metrics to a file that is used to update the UI and send data to Azure. All of the code for this is posted to my github repository.
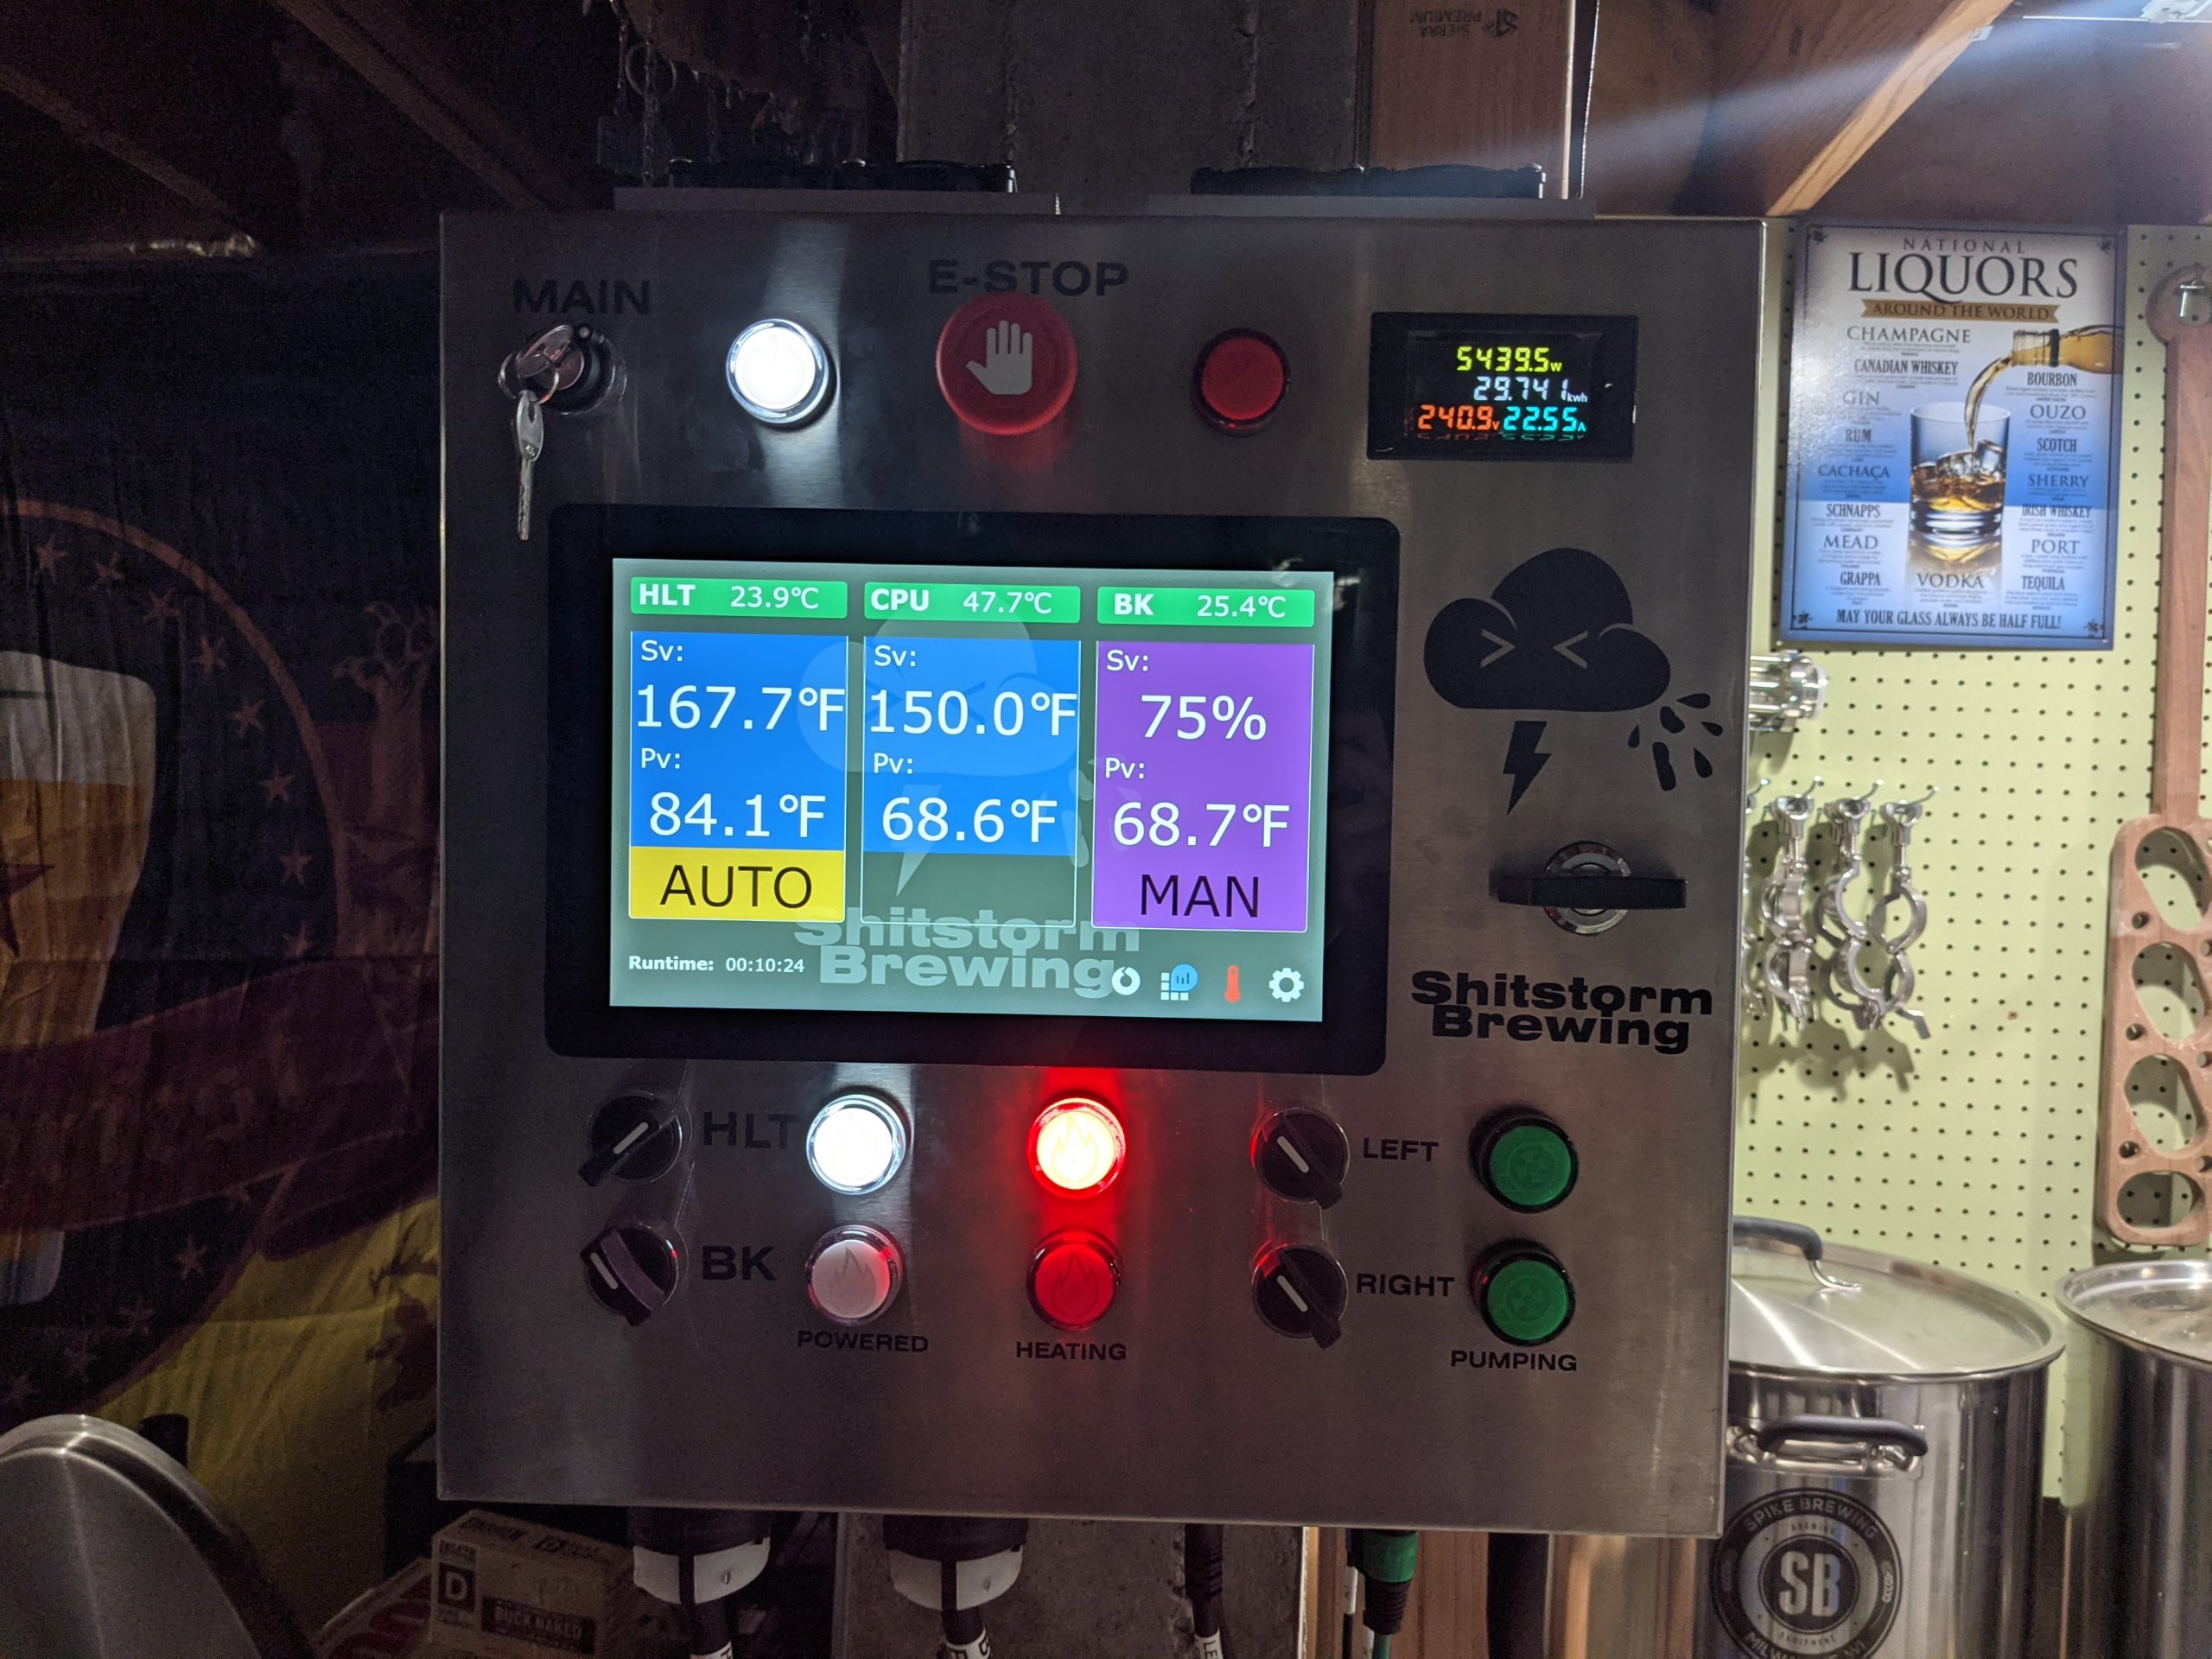
UI
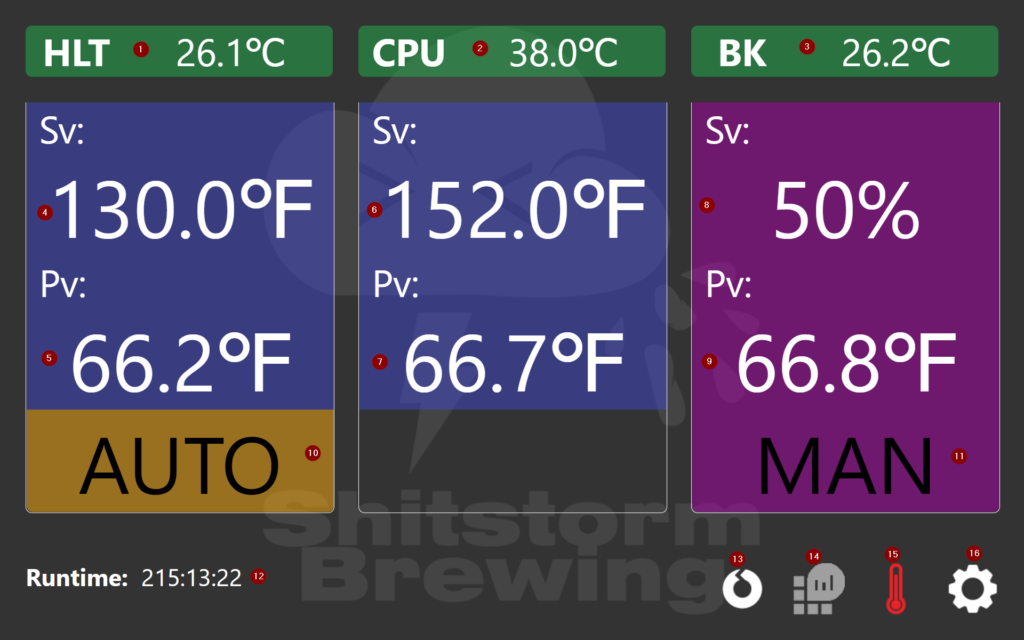
- Hot Liquor Tank SSR Heatsink Temperature – Monitored using a LM35DZ chip.
- CPU Temperature – pulled via the gpiozero python module
- Boil Kettle SSR Heatsink Temperature – Monitored using an LM35DZ chip.
- HLT Set Value – When in AUTO Mode, the controller will attempt to maintain the indicated temperature +/- the value of the Hysteresis.
- HLT Process Value – The value currently read from the DS18B20 probe in the HLT.
- Mash Tun SV – Currently, this is only used to toggle the color of the background of the MT temperature. Should I add more advanced logic or automation in the future, this can be used to control more of the process.
- MT PV – This is fed by another DS18B20 probe just like the HLT, only in the MT.
- BK SV – In this instance, the Set Value is indicated by a percentage. Instead of using temperature to control the heating element, we simply run it for a portion of the interval (in this case, 50%). The interval length can be configured to adjust the length of time the element is on or off.
- BK PV – Another DS18B20, only this one is in the… wait for it… Boil Kettle.
- HLT Mode – This can be toggled between AUTO or Temperature Mode, and MAN or Manual mode. Auto mode is controlled based on the temperature and hysteresis to determine whether the element is on or off.
- BK Mode – Same as #10, but for the BK.
- Total Runtime – How long the controller has been running (HH:mm:ss)
- UI Refresh – Allows the UI to be force refreshed at will.
- Toggles the Log Analytics Ingstion on or off.
- Toggles the Temperature controller on or off.
- Config.
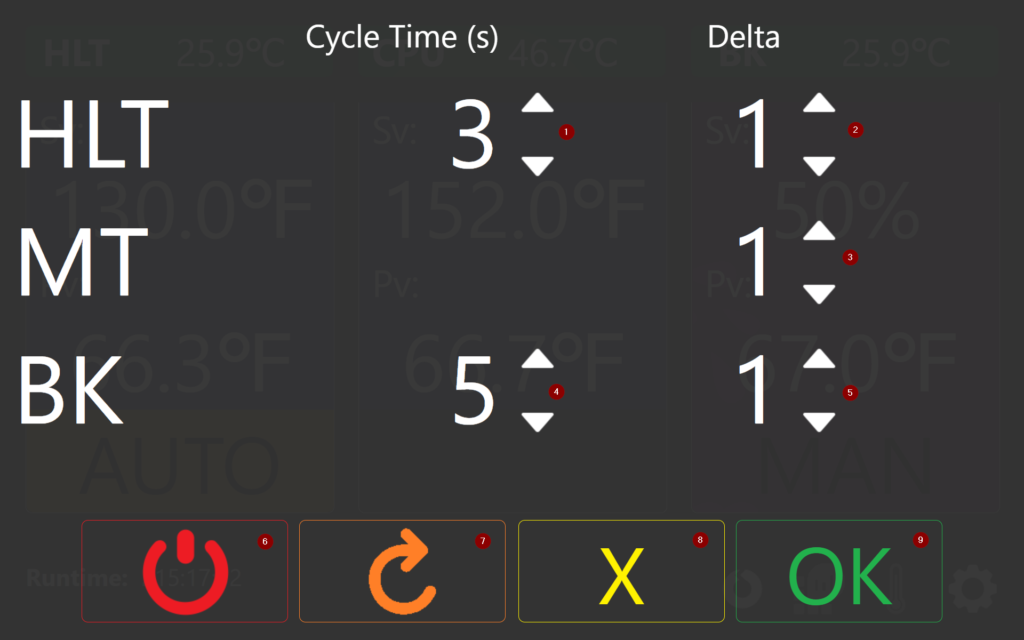
- HLT Cycle – How many seconds between each evaluation of the temperature to determine whether or not the element should
- HLT Delta (Hysteresis). If the Pv is above or below the Sv by more than the Hysteresis, the element is cycled on or off.
- MT Delta
- BK Cycle Time
- BK Delta
- Shutdown System
- Restart System
- Cancel
- Confirm
azure.py
The azure.py script is what sends the data to Log Analytics. It consists of 4 main portions. The settings are loaded by reading the conf.json file and reading the WorkspaceId, WorkspaceKey, and LogName parameters. The WorkspaceId is the guid for the Log Analytics workspace. The Key is either the primary or secondary key. The keys and workspace ID can all be found under Agent Management (formerly advanced settings). LogName is the name of the log that will show up in Log Analytics. Like all other custom log sources, ‘_CL’ will be automatically appended to the end of whatever name you use. Our first function builds the signature to authenticate our POST requests.
def build_signature(customer_id, shared_key, date, content_length, method, content_type, resource):
    x_headers = 'x-ms-date:' + date
    string_to_hash = method + "\n" + str(content_length) + "\n" + content_type + "\n" + x_headers + "\n" + resource
    bytes_to_hash = bytes(string_to_hash).encode('utf-8')
    decoded_key = base64.b64decode(shared_key)
    encoded_hash = base64.b64encode(hmac.new(decoded_key, bytes_to_hash, digestmod=hashlib.sha256).digest())
    authorization = "SharedKey {}:{}".format(customer_id,encoded_hash)
    return authorization
The build signature function takes a few parameters. All of the parameters are passed to it by the next function. build_signature will build a SHA256 hash based on our keys, the date and time (RFC 1123 format), and the length of the content being passed. This allows us to generate a 1-way hash that can be used by Azure to authenticate the payload once it arrives without having to pass our key.
def post_data(customer_id, shared_key, body, log_type):
    method = 'POST'
    content_type = 'application/json'
    resource = '/api/logs'
    rfc1123date = datetime.datetime.utcnow().strftime('%a, %d %b %Y %H:%M:%S GMT')
    content_length = len(body)
    signature = build_signature(customer_id, shared_key, rfc1123date, content_length, method, content_type, resource)
    uri = 'https://' + customer_id + '.ods.opinsights.azure.com' + resource + '?api-version=2016-04-01'
    headers = {
        'content-type': content_type,
        'Authorization': signature,
        'Log-Type': log_type,
        'x-ms-date': rfc1123date
    }
    response = requests.post(uri,data=body, headers=headers)
post_data is the function that we interact with directly to send the information to Azure. It will call build_signature and form the payload. It takes our Workspace ID, Workspace Key, Body (JSON formated string), and name of the log. Since we store our data or payload in JSON format, we don’t have to do much else other than read the json file and pass it along.
def OnKill(signum, frame):
    global run
    run = False
signal.signal(signal.SIGINT, OnKill)
signal.signal(signal.SIGTERM, OnKill)
This is our exit handler. Since the script runs in the background and we don’t directly interact with it, we need a way to tell it to exit and what to do when we tell it to do so. We use the signal library to handle these. First we define our function that gets called (OnKill) and then we register handlers to call it depending on which type of signal was sent to the application. The first registers it to handle “INT” signals. In our case, this would be like hitting Ctrl+C from an SSH terminal to kill the running application or using kill -2 <pid>. The second intercepts “TERM” signals or kill -15 <pid>. If either of these signals is sent to our program, tell our program to set the run variable to false which causes our loop in the next code block to stop looping.
while run:
    try:
        #Read Current Data Points
        f = open('/var/www/html/py/data.json', 'r')
        data = json.load(f)
        f.close()
        body = json.dumps(data)
        post_data(customer_id, shared_key, body, log_type)
    except Exception as e:
        now = datetime.datetime.now()
        print(e)
        f = open('/var/www/html/python_errors.log', 'a')
        f.write("%s - AZURE [%i] - %s\n" % (now.strftime("%Y-%m-%d %H:%M:%S"), sys.exc_info()[-1].tb_lineno, e))
        f.close()
    time.sleep(LoopDelay)
This loop will continue to run as long as run is set to True. If we receive one of the signals mentioned earlier (SIGINT or SIGTERM) we set run to False and kill the loop. The loop is simple. It pulls the latest data from the data.json file and passes it as the payload to Log Analytics using the REST API. Our data.json file looks like this:
{
    "MtAuto": 152,
    "HltAuto": 130,
    "BkStatus": 0,
    "BkMode": "M",
    "HltStatus": 1,
    "HltHsTemp": 25.93,
    "BkAuto": 8.7,
    "MtTemp": 66.65,
    "HltDelta": 1,
    "BkTemp": 66.988,
    "MtDelta": 1,
    "HltMan": 50,
    "BkMan": 50,
    "CpuTemp": 46.738,
    "BkHsTemp": 25.88,
    "HltCycle": 3,
    "BkCycle": 5,
    "HltTemp": 66.313,
    "HltMode": "A",
    "BkDelta": 1
}
This is the data that we pass to Log Analytics which can then be queried. In the below example, we pull a count of all entries where the measured HLT Temp was higher than the set point + delta and bin it in 5 minute intervals. These would be periods where we overshoot our temps.
BrewController_CL
| where HltTemp > (HltAuto + HltDelta)
| summarize count() by bin(TimeGenerated, 5m)
If you’re thinking to yourself that the azure code looks familiar, yes, it probably does. It’s the code that’s available on the Azure Monitor Data Collector API page. I’m using the python 2 version of the code.
tempcontrol.py
The temp control script is where most of the magic happens. This is where we read our sensor data, act on it (if needed) and write the data to a file for the UI or Azure script to ingest and process.
 while run:
        currTime = round(time.time(), 1)
        #Update existing values
        if UpdateTemps:
            #Load Data
            f = open('/var/www/html/py/data.json', 'r')
            data = json.load(f)
            f.close()
            #Update Data
            data['HltHsTemp'] = GetHeatsink(0)
            data['CpuTemp'] = GetCPU()
            data['BkHsTemp'] = GetHeatsink(1)
            data['HltTemp'] = THERMO.getTEMP(0,11)
            data['MtTemp'] = THERMO.getTEMP(0,10)
            data['BkTemp'] = THERMO.getTEMP(0,9)
            UpdateTemps = False
            #Update Uptime File
            f = open('/var/www/html/py/uptime', 'w')
            f.write(str(currTime - startTime))
            f.close()
            #Check for Updated Targets
                #Mode
            if os.path.exists('/var/www/html/py/mode.json'):
                f = open('/var/www/html/py/mode.json', 'r')
                NewData = json.load(f)
                f.close()
                if NewData['Target'] == 'hlt':
                    data['HltMode'] = NewData['NewMode']
                elif NewData['Target'] == 'bk':
                    data['BkMode'] = NewData['NewMode']
                os.remove('/var/www/html/py/mode.json')
                #Temp
            if os.path.exists('/var/www/html/py/temp.json'):
                f = open('/var/www/html/py/temp.json', 'r')
                NewData = json.load(f)
                f.close()
                if NewData['Target'] == 'hlt' and NewData['Mode'] == 'a':
                    data['HltAuto'] = NewData['Value']
                elif NewData['Target'] == 'hlt' and NewData['Mode'] == 'm':
                    data['HltMan'] = NewData['Value']
                elif NewData['Target'] == 'mt' and NewData['Mode'] == 'a':
                    data['MtAuto'] = NewData['Value']
                elif NewData['Target'] == 'bk' and NewData['Mode'] == 'a':
                    data['BkAuto'] = NewData['Value']
                elif NewData['Target'] == 'bk' and NewData['Mode'] == 'm':
                    data['BkMan'] = NewData['Value']
                os.remove('/var/www/html/py/temp.json')
                #Settings
            if os.path.exists('/var/www/html/py/settings.json'):
                f = open('/var/www/html/py/settings.json', 'r')
                NewData = json.load(f)
                f.close()
                data['HltCycle'] = NewData['HltCycle']
                data['HltDelta'] = NewData['HltDelta']
                data['MtDelta'] = NewData['MtDelta']
                data['BkCycle'] = NewData['BkCycle']
                data['BkDelta'] = NewData['BkDelta']
                os.remove('/var/www/html/py/settings.json')
        else:
            UpdateTemps = True
        #HLTControl
        if data['HltMode'] == 'A':
            HLTOn = ActionCount + 1
            if data['HltTemp'] < (data['HltAuto'] - data['HltDelta']):
                TurnHLTOn()
            else:
                TurnHLTOff()
        else:
            if HLTOn == ActionCount:
                TurnHLTOn()
                HltCycleLen = data['HltCycle'] * 2
                HLTOn = ActionCount + HltCycleLen
                HLTOff = ActionCount + ((float(data['HltMan']) / 100) * HltCycleLen)
            if HLTOff == ActionCount:
                TurnHLTOff()
            elif HLTOn < ActionCount and HLTOff < ActionCount:
                HLTOn = ActionCount + 1

        #BKControl
        if data['BkMode'] == 'A':
            BKOn = ActionCount + 1
            if data['BkTemp'] < (data['BkAuto'] - data['BkDelta']):
                TurnBKOn()
            else:
                TurnBKOff()
        else:
            if BKOn == ActionCount:
                TurnBKOn()
                BkCycleLen = data['BkCycle'] * 2
                BKOn = ActionCount + BkCycleLen
                BKOff = ActionCount + ((float(data['BkMan']) / 100) * BkCycleLen)
            if BKOff == ActionCount:
                TurnBKOff()
            elif BKOn < ActionCount and BKOff < ActionCount:
                BKOn = ActionCount + 1
        ActionCount += 1
        #Save Data
        f = open('/var/www/html/py/data.json', 'w')
        json.dump(data, f)
        f.close()
        #Sleep
        time.sleep(0.5)
except Exception as e:
    now = datetime.now()
    print(e)
    f = open('/var/www/html/python_errors.log', 'a')
    f.write("%s - TEMP CONTROL [%i] - %s\n" % (now.strftime("%Y-%m-%d %H:%M:%S"), sys.exc_info()[-1].tb_lineno, e))
    f.close()
We start with reading the temp probe data starting on line 5. Since our DS18B20 probes only update once per second, and our loop runs every 1/2 second, there is no need to update them every loop. We use a simple bool flag to run this portion of code every other loop. Next, we check our HLT and BK to determine whether to cycle them on, off, or do nothing. If we’re in automatic mode, we check the current temp (Pv) and compare it against the target temp (Sv) and hysteresis (Delta). If Pv < (Sv – Delta) then we turn the element on. If not, we turn it off. On a true PID controller, the element might remain on longer in order to stabilise the temperature and reduce the variance. So far, I’ve found that I haven’t needed the more advanced logic of a true PID controller to keep my temps where I need them, so I’ve opted to keep things simple. I may end up switching it to PID logic should I find that not the case, but the first couple batches that I’ve done on the system have been really good. If the elements are in manual mode, we take a look at the cycle length, compare it to on percentage and calculate the number of loops the element should be on and off. We then set each into a variable that tells it when to turn on.
Azure Monitor Workbook
So, we’re brewing beer and putting data into Azure. How do we use that data? I have a TV in my brew area that I pull the workbook up on on brew day. This allows me to monitor data and trends and make adjustments whether it be for that brew session, or the next one.
What does this mean?
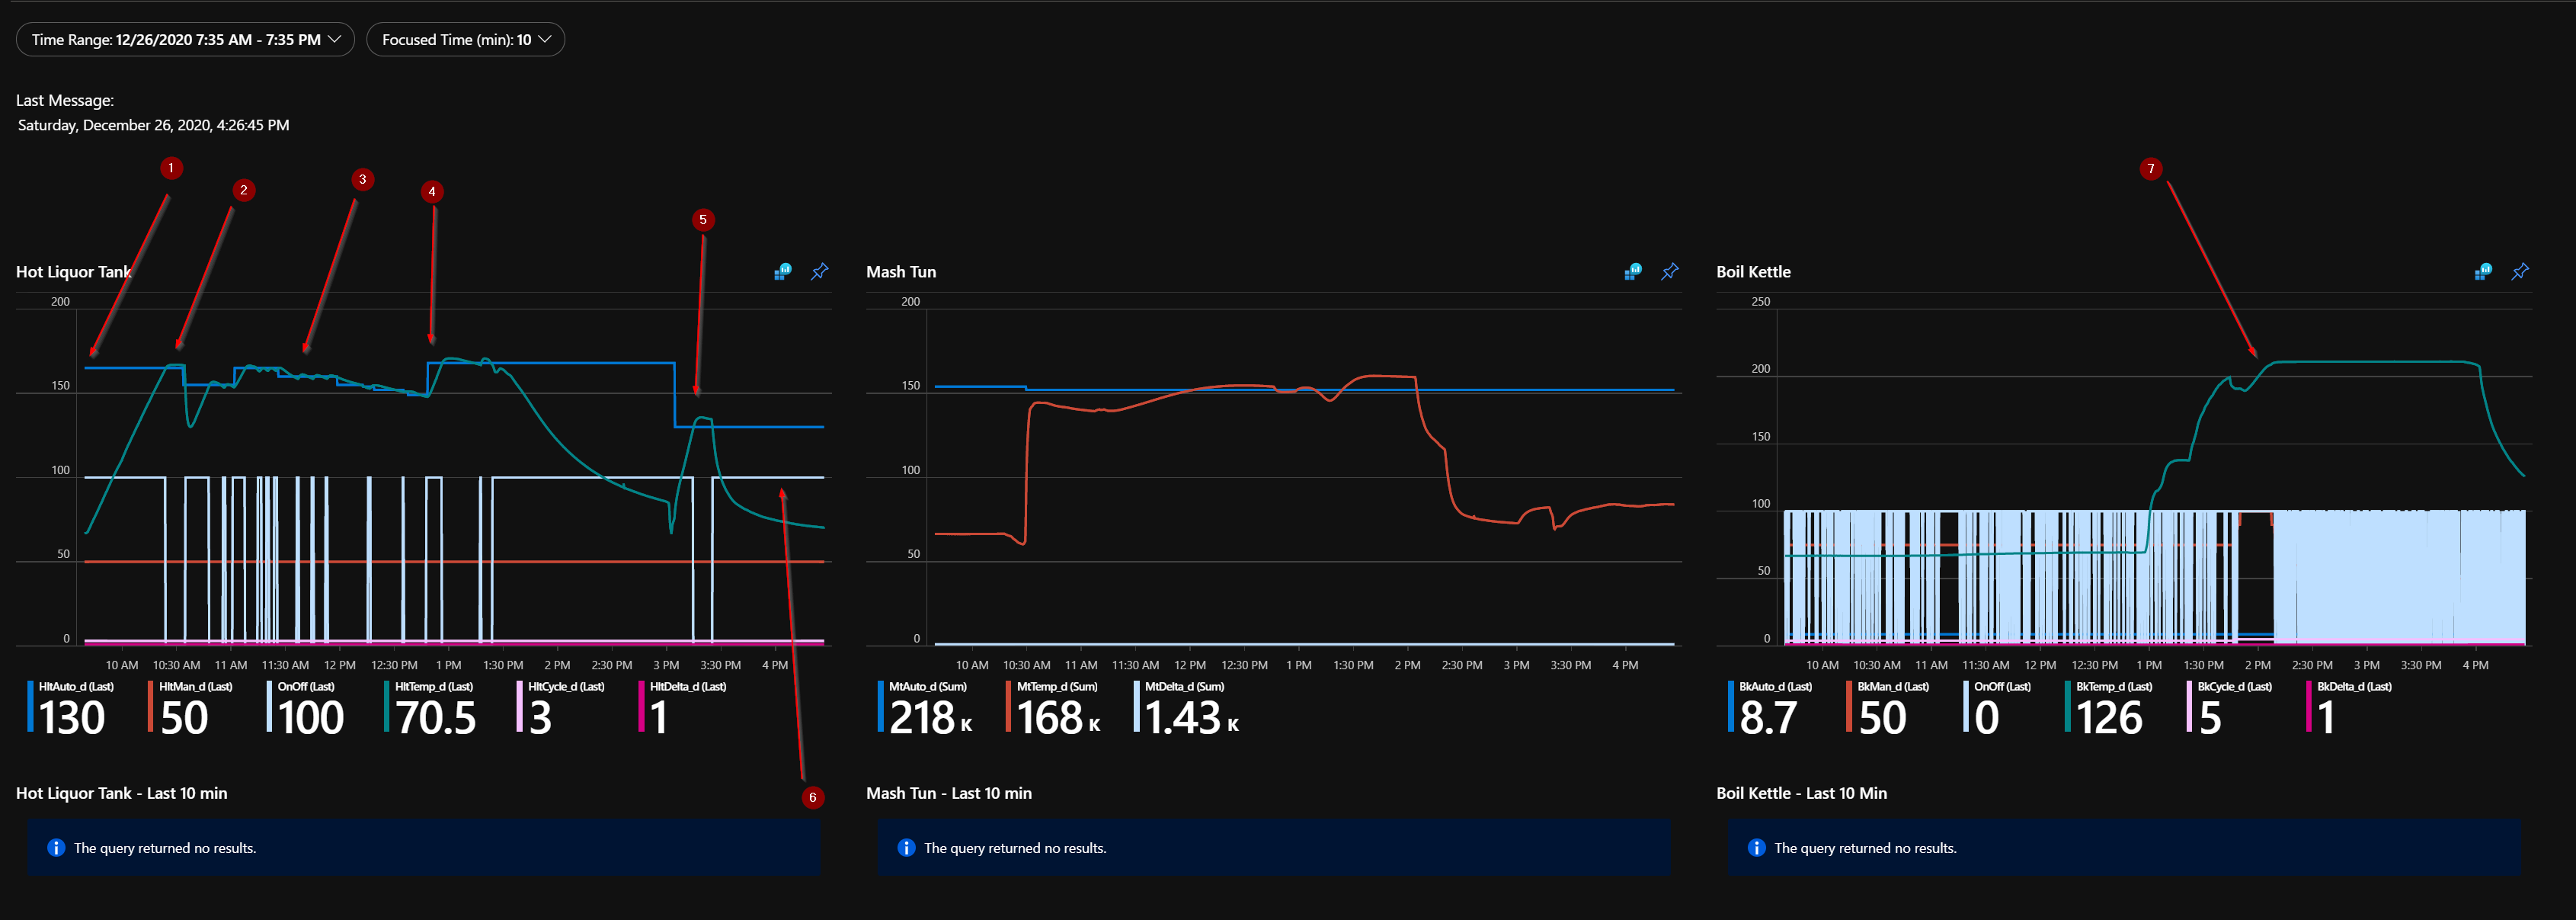
I’ve marked a few points on the image above which show some interesting points in our brew day.
- You can see the blue line on the HLT graph set to our strike temperature which was 165℉ for this recipe. You can also see the greenish line that indicates that actual temperature of the water. For this, I was heating around 18 Gal of water from room temp (about 68℉) to our strike temperature.
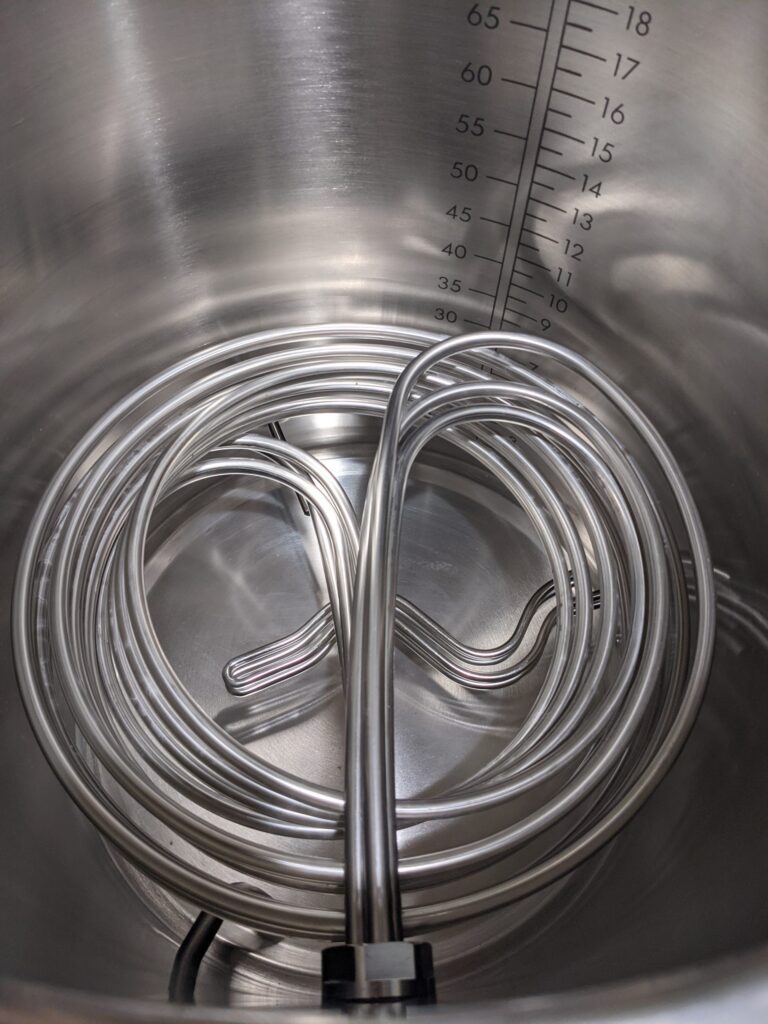
- At point 2, we hit our strike temp and can perform our mash in. You’ll notice that a few minutes after we hit temp, it plumets to around 130℉ and then starts to rise again. After I mashed in, I added another 5 Gal of water to the HLT to ensure I had enough for mash out/sparge. Since the water I added was also at room temp, it dropped the temperature of the HLT down which then gets heated back up. You’ll also notice that I reduced the set point of the HLT at this time. I make use of a HERMS coil to maintain mash temperatures, so once mashing in is taken care of, I set the temperature of my HLT to whatever temperature I want my mash to be and then re-circulate it through the HERMS (pictures below).
- The area around point 3 is where I ran into a problem. Some of the rice hulls that I was using as a filter bed got sucked into the hoses. It took me a while to figure out what was going on. The sprayer that I was using to evenly distribute water across the top of the grain bed got clogged by the rice hulls. Water was still coming out, but it wasn’t re-circulating enough water to affect the mash temperature. I swapped out the end of my re-circulation sprayer with a different style which included a larger opening. Once in place, temperatures were back where I wanted them.
- Number 4 is where I performed my mash out. I raised to the HLT temp to 168℉ to halt conversion and began sparging. The point where the temperature starts to drop is the point that I shut the element override off from the switch on the control panel. The controller doesn’t see this which is why we have a divergence from the set value and process value.
- Point 5 is where I added and heated up some additional water to use for cleaning.
- Point 6 calls out the light blue lines. These are used to indicate when the element is “on” as far as the controller is concerned. On the HLT it’s pretty easy to see the periods where the element is on and off. On the BK, it’s a bit more condensed since it’s in manual mode and automatically firing quite rapidly. I have found so far that with a 5 second cycle length and the element on 50%, I can maintain a nice boil without boiling over.
- You’ll notice at Point 7, there is a sharp hook, a dip, and then a climb before it levels off. Before this point, I had my element set to something like 75% or 80%. This was a bit too aggressive and caused a near boil-over. The spike is the point where I turned the BK override off, made some adjustments, and turned it back on.
Dashboard Template
{
  "version": "Notebook/1.0",
  "items": [
    {
      "type": 9,
      "content": {
        "version": "KqlParameterItem/1.0",
        "parameters": [
          {
            "id": "ee40ef7f-bcea-4d1c-a3da-fca1355319cd",
            "version": "KqlParameterItem/1.0",
            "name": "TimeRange",
            "label": "Time Range",
            "type": 4,
            "isRequired": true,
            "value": {
              "durationMs": 43200000,
              "endTime": "2020-12-27T01:35:00.000Z"
            },
            "typeSettings": {
              "selectableValues": [
                {
                  "durationMs": 300000
                },
                {
                  "durationMs": 900000
                },
                {
                  "durationMs": 1800000
                },
                {
                  "durationMs": 3600000
                },
                {
                  "durationMs": 14400000
                },
                {
                  "durationMs": 43200000
                },
                {
                  "durationMs": 86400000
                }
              ],
              "allowCustom": true
            },
            "timeContext": {
              "durationMs": 86400000
            }
          },
          {
            "id": "9c69ebb2-0553-43b3-9662-162cd0a650b0",
            "version": "KqlParameterItem/1.0",
            "name": "FocusTime",
            "label": "Focused Time (min)",
            "type": 1,
            "isRequired": true,
            "value": "10",
            "typeSettings": {
              "paramValidationRules": [
                {
                  "regExp": "[\\d]*",
                  "match": true,
                  "message": "Must be a Number"
                }
              ]
            },
            "timeContext": {
              "durationMs": 86400000
            }
          }
        ],
        "style": "pills",
        "queryType": 0,
        "resourceType": "microsoft.operationalinsights/workspaces"
      },
      "name": "parameters - 5"
    },
    {
      "type": 3,
      "content": {
        "version": "KqlItem/1.0",
        "query": "BrewDay_CL\r\n| top 1 by TimeGenerated\r\n| extend Title = \"Last Message:\"\r\n| project TimeGenerated, Title",
        "size": 4,
        "timeContext": {
          "durationMs": 43200000,
          "endTime": "2020-12-27T01:35:00.000Z"
        },
        "timeContextFromParameter": "TimeRange",
        "queryType": 0,
        "resourceType": "microsoft.operationalinsights/workspaces",
        "visualization": "tiles",
        "tileSettings": {
          "titleContent": {
            "columnMatch": "Title"
          },
          "leftContent": {
            "columnMatch": "TimeGenerated",
            "formatter": 6
          },
          "showBorder": false,
          "size": "full"
        }
      },
      "name": "query - 4"
    },
    {
      "type": 3,
      "content": {
        "version": "KqlItem/1.0",
        "query": "BrewDay_CL\r\n| project TimeGenerated, HltAuto_d, HltMan_d, OnOff = HltStatus_d * 100, HltTemp_d, HltCycle_d, HltDelta_d",
        "size": 0,
        "aggregation": 5,
        "showAnalytics": true,
        "title": "Hot Liquor Tank",
        "timeContext": {
          "durationMs": 43200000,
          "endTime": "2020-12-27T01:35:00.000Z"
        },
        "timeContextFromParameter": "TimeRange",
        "queryType": 0,
        "resourceType": "microsoft.operationalinsights/workspaces",
        "visualization": "linechart"
      },
      "customWidth": "33",
      "showPin": true,
      "name": "HltOverall"
    },
    {
      "type": 3,
      "content": {
        "version": "KqlItem/1.0",
        "query": "BrewDay_CL\r\n| where (TimeGenerated > {TimeRange:start}) and (TimeGenerated < {TimeRange:end})\r\n| project TimeGenerated, MtAuto_d, MtTemp_d, MtDelta_d",
        "size": 0,
        "showAnalytics": true,
        "title": "Mash Tun",
        "timeContext": {
          "durationMs": 43200000,
          "endTime": "2020-12-27T01:35:00.000Z"
        },
        "timeContextFromParameter": "TimeRange",
        "queryType": 0,
        "resourceType": "microsoft.operationalinsights/workspaces",
        "visualization": "linechart"
      },
      "customWidth": "33",
      "showPin": true,
      "name": "MtOverall"
    },
    {
      "type": 3,
      "content": {
        "version": "KqlItem/1.0",
        "query": "BrewDay_CL\r\n| project TimeGenerated, BkAuto_d, BkMan_d, OnOff = BkStatus_d * 100, BkTemp_d, BkCycle_d, BkDelta_d",
        "size": 0,
        "aggregation": 5,
        "showAnalytics": true,
        "title": "Boil Kettle",
        "timeContext": {
          "durationMs": 43200000,
          "endTime": "2020-12-27T01:35:00.000Z"
        },
        "timeContextFromParameter": "TimeRange",
        "queryType": 0,
        "resourceType": "microsoft.operationalinsights/workspaces",
        "visualization": "linechart"
      },
      "customWidth": "33",
      "showPin": true,
      "name": "BkOverall"
    },
    {
      "type": 3,
      "content": {
        "version": "KqlItem/1.0",
        "query": "BrewDay_CL\r\n| where TimeGenerated > ago({FocusTime:value}m)\r\n| project TimeGenerated, HltAuto_d, HltMan_d, OnOff = HltStatus_d * 100, HltTemp_d, HltCycle_d, HltDelta_d",
        "size": 0,
        "title": "Hot Liquor Tank - Last {FocusTime:value} min",
        "queryType": 0,
        "resourceType": "microsoft.operationalinsights/workspaces",
        "visualization": "linechart"
      },
      "customWidth": "33",
      "name": "HltFocused"
    },
    {
      "type": 3,
      "content": {
        "version": "KqlItem/1.0",
        "query": "BrewDay_CL\r\n| where TimeGenerated > ago({FocusTime:value}m)\r\n| project TimeGenerated, MtAuto_d, MtTemp_d, MtDelta_d",
        "size": 0,
        "title": "Mash Tun - Last {FocusTime:value} min",
        "queryType": 0,
        "resourceType": "microsoft.operationalinsights/workspaces",
        "visualization": "linechart"
      },
      "customWidth": "33",
      "name": "MtFocused"
    },
    {
      "type": 3,
      "content": {
        "version": "KqlItem/1.0",
        "query": "BrewDay_CL\r\n| where TimeGenerated > ago({FocusTime:value}m)\r\n| project TimeGenerated, BkAuto_d, BkMan_d, OnOff = BkStatus_d * 100, BkTemp_d, BkCycle_d, BkDelta_d",
        "size": 0,
        "title": "Boil Kettle - Last {FocusTime:value} Min",
        "queryType": 0,
        "resourceType": "microsoft.operationalinsights/workspaces",
        "visualization": "linechart"
      },
      "customWidth": "33",
      "name": "BkLastFive"
    },
    {
      "type": 3,
      "content": {
        "version": "KqlItem/1.0",
        "query": "BrewDay_CL\r\n| project TimeGenerated, Target=HltAuto_d, Temperature=HltTemp_d, Manual=HltMan_d",
        "size": 0,
        "aggregation": 5,
        "showAnalytics": true,
        "title": "Hot Liquor Tank",
        "timeContext": {
          "durationMs": 172800000
        },
        "queryType": 0,
        "resourceType": "microsoft.operationalinsights/workspaces",
        "visualization": "linechart",
        "chartSettings": {
          "seriesLabelSettings": [
            {
              "seriesName": "Target",
              "color": "blue"
            },
            {
              "seriesName": "Temperature",
              "color": "turquoise"
            },
            {
              "seriesName": "Manual",
              "color": "greenDark"
            }
          ]
        }
      },
      "showPin": true,
      "name": "query - 8"
    },
    {
      "type": 3,
      "content": {
        "version": "KqlItem/1.0",
        "query": "BrewDay_CL\r\n| project TimeGenerated, Target=MtAuto_d, Temperature=MtTemp_d",
        "size": 0,
        "aggregation": 5,
        "showAnalytics": true,
        "title": "Mash Tun",
        "timeContext": {
          "durationMs": 172800000
        },
        "queryType": 0,
        "resourceType": "microsoft.operationalinsights/workspaces",
        "visualization": "linechart",
        "chartSettings": {
          "seriesLabelSettings": [
            {
              "seriesName": "Target",
              "color": "redBright"
            },
            {
              "seriesName": "Temperature",
              "color": "yellow"
            }
          ]
        }
      },
      "showPin": true,
      "name": "query - 9"
    },
    {
      "type": 3,
      "content": {
        "version": "KqlItem/1.0",
        "query": "BrewDay_CL\r\n| project TimeGenerated, Target = BkAuto_d, Temperature = BkTemp_d, Manual = BkMan_d",
        "size": 0,
        "aggregation": 5,
        "showAnalytics": true,
        "title": "Boil Kettle",
        "timeContext": {
          "durationMs": 172800000
        },
        "queryType": 0,
        "resourceType": "microsoft.operationalinsights/workspaces",
        "visualization": "linechart",
        "chartSettings": {
          "seriesLabelSettings": [
            {
              "seriesName": "Target",
              "color": "purple"
            },
            {
              "seriesName": "Temperature",
              "color": "green"
            },
            {
              "seriesName": "Manual",
              "color": "blue"
            }
          ]
        }
      },
      "showPin": true,
      "name": "query - 10"
    }
  ],
  "fallbackResourceIds": [
    "/subscriptions/<SUBSCRIPTIONID>/resourcegroups/<RESOURCEGROUP>/providers/Microsoft.OperationalInsights/workspaces/<WORKSPACENAME>"
  ],
  "$schema": "https://github.com/Microsoft/Application-Insights-Workbooks/blob/master/schema/workbook.json"
}
You’ll need to replace <SUBSCRIPTIONID>, <RESOURCEGROUP>, and <WORKSPACENAME> with appropriate values should you want to utilize this in your environment. From a data standpoint, I’ve found that a single brew day uses less than 200KB of quota. Even if you brew every day, you’ll likely never exceed the 5GB of free usage to incur a charge (based on current pricing plans as of 2021-01-01).
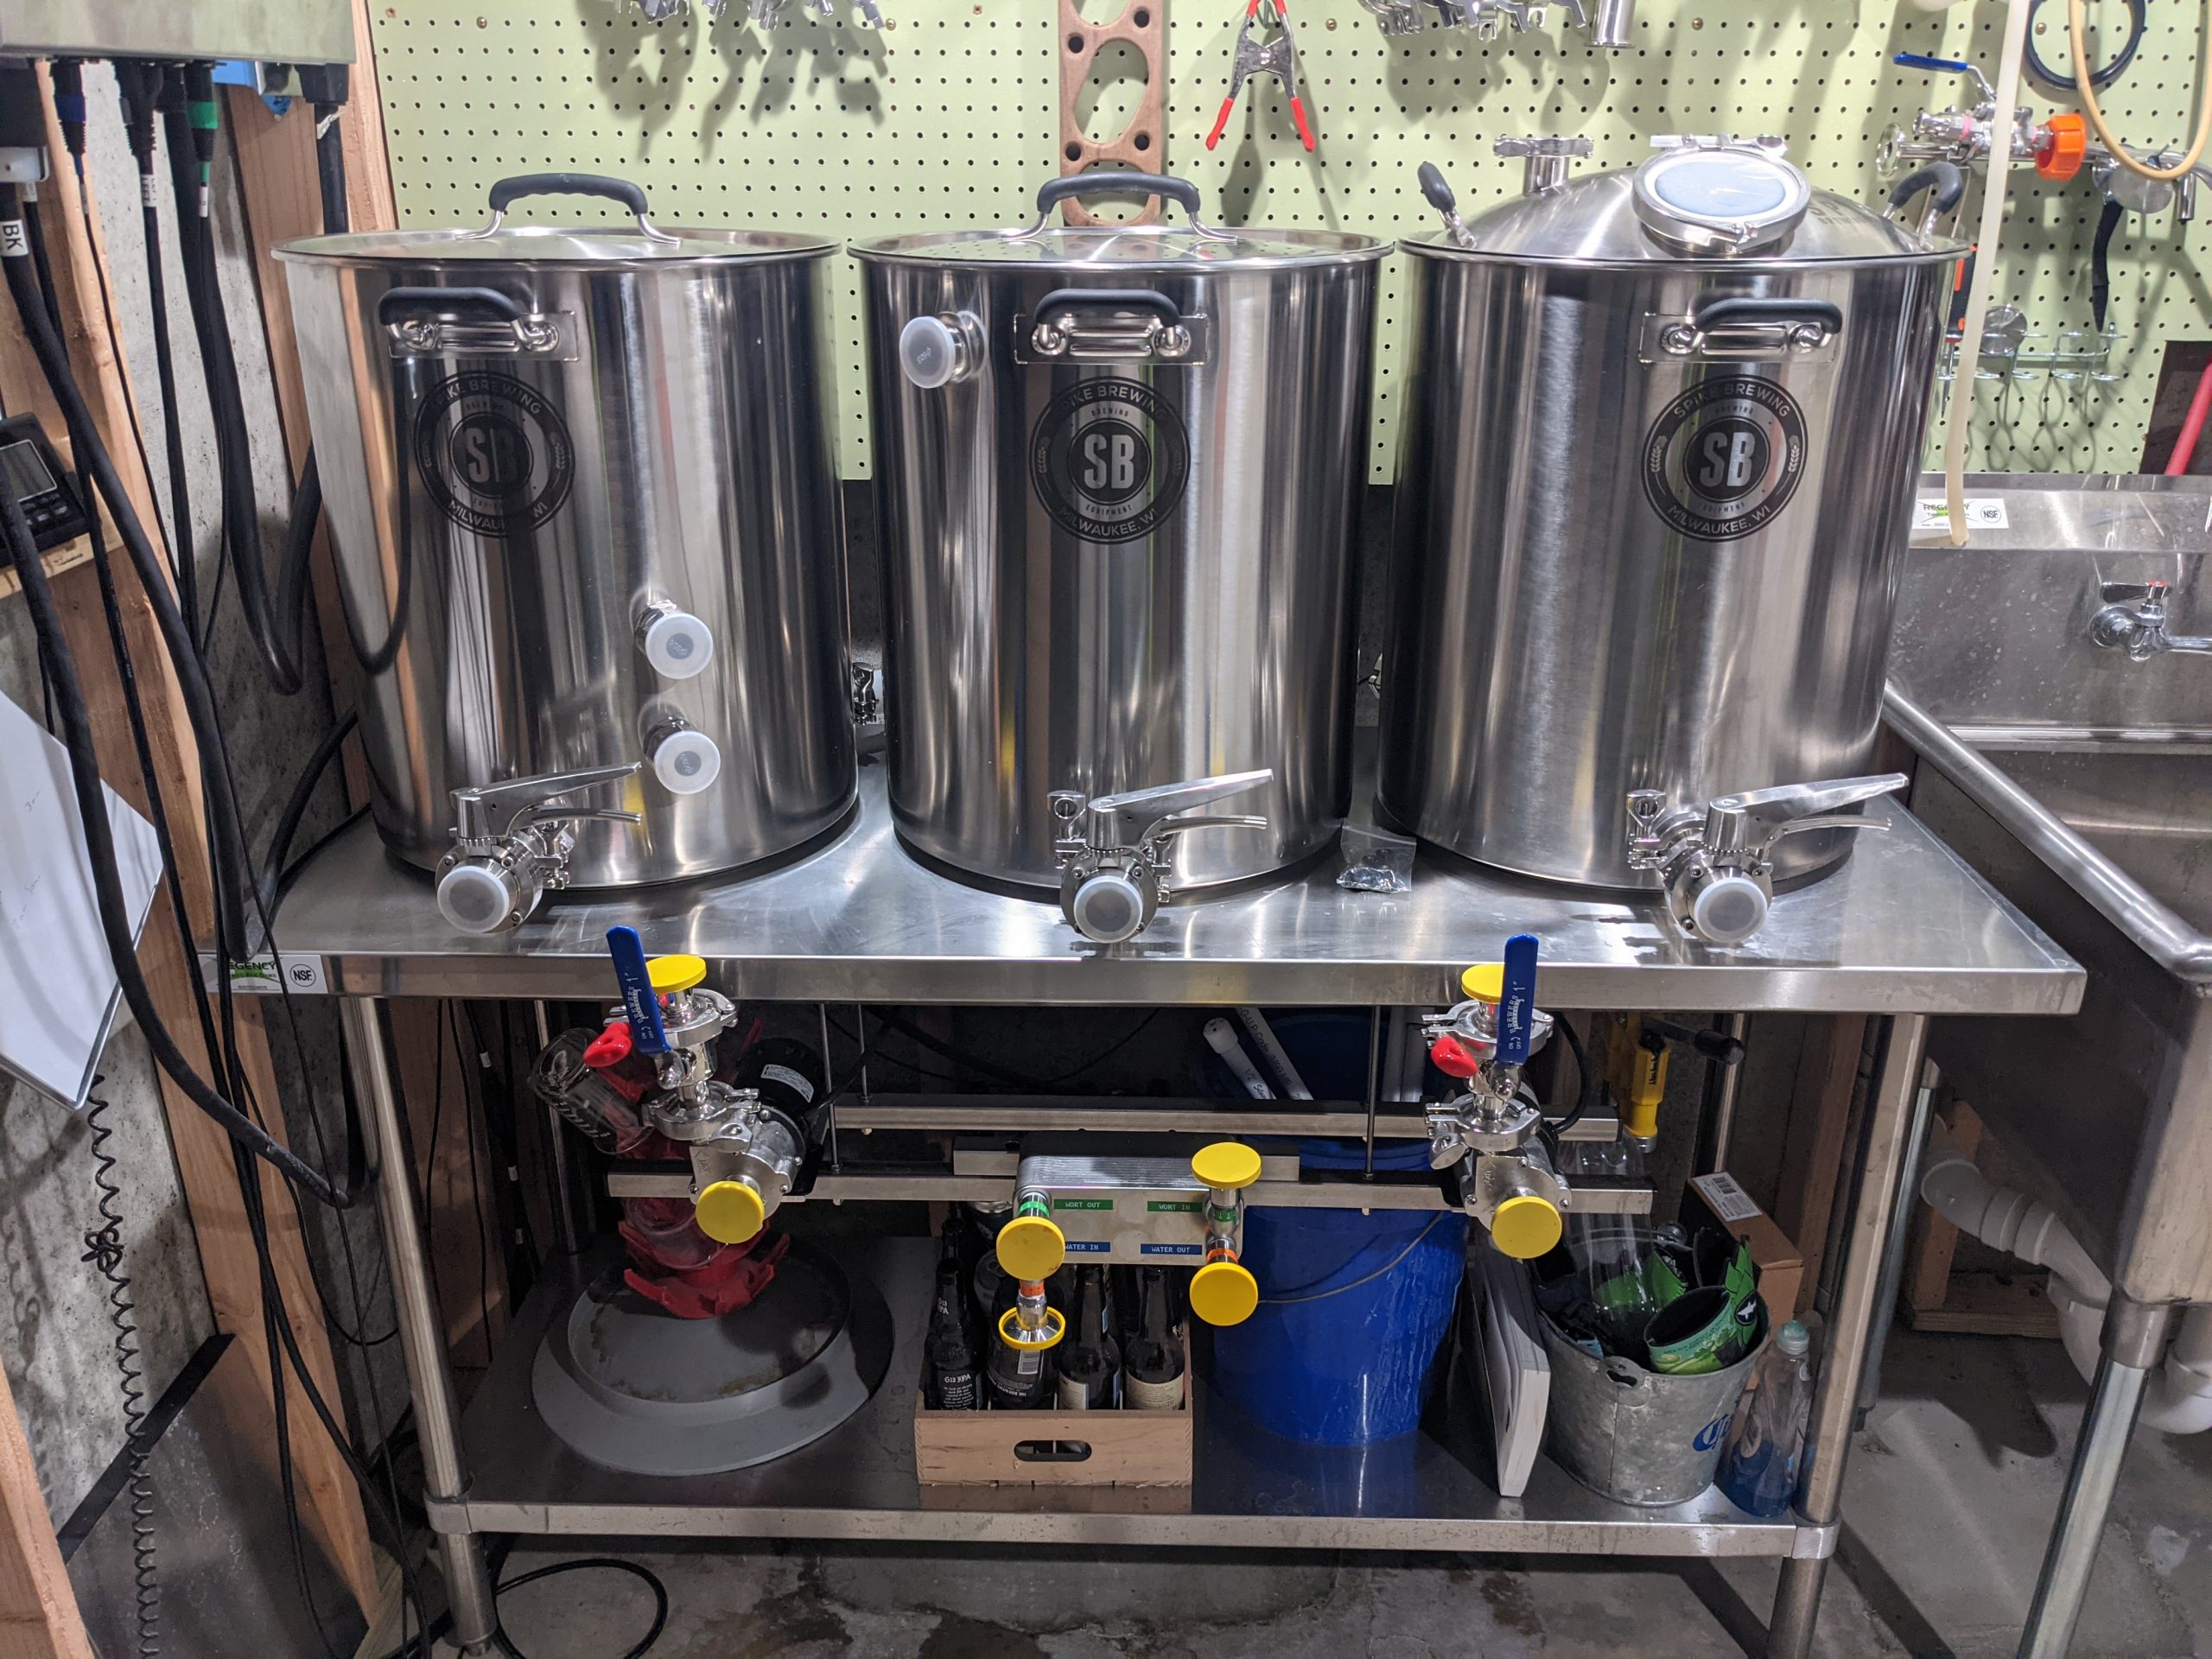
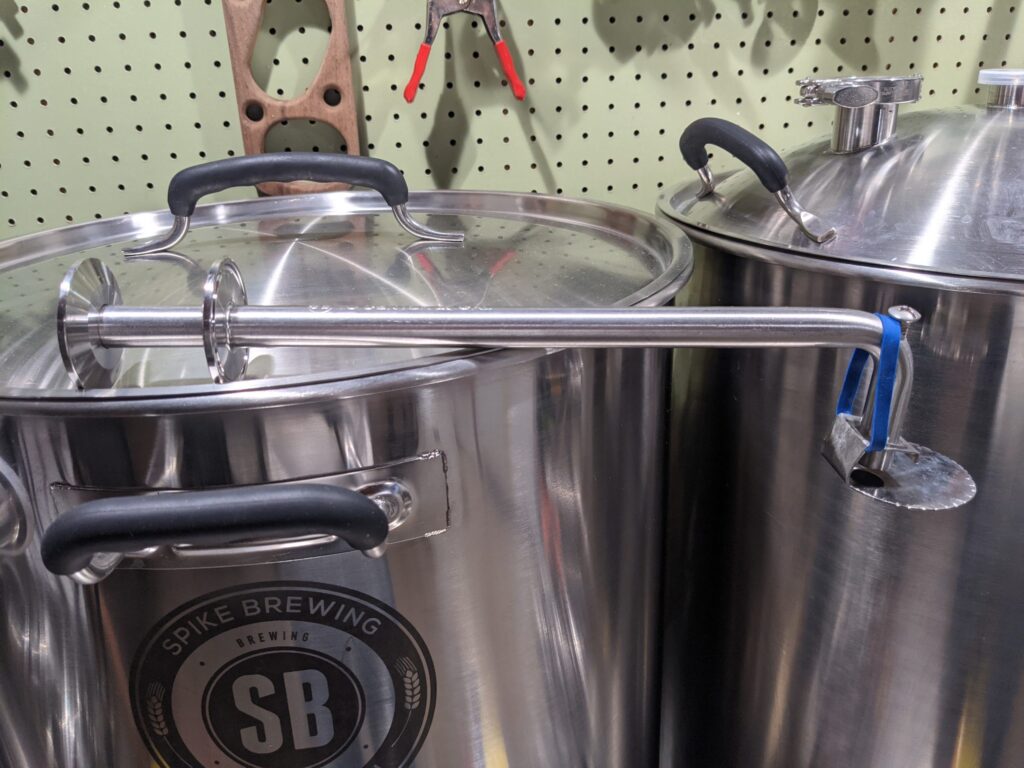
Brewery Pictures
Build Costs & Parts List
The total cost of the build wasn’t actually as bad as I thought it might have been. The panel ended up a just over $1,600 and the brewery itself was just over $4,100. Those prices do not include shipping, but for most items, shipping was free. I would add probably another $100 to the overall total for shipping from places that it wasn’t free. The build sheet can be found on my OneDrive. There are two separate tabs; one for the panel, and one for the brewery. On the brewery side of things, there were many pieces of equipment that I already had from my last brewery, so this is not a comprehensive list for everything you need if you have nothing (things like hydrometers, scales, grain mill, etc). All of the source code is on my GitHub.
Thanks
I’d like to give a special thanks to a few people.
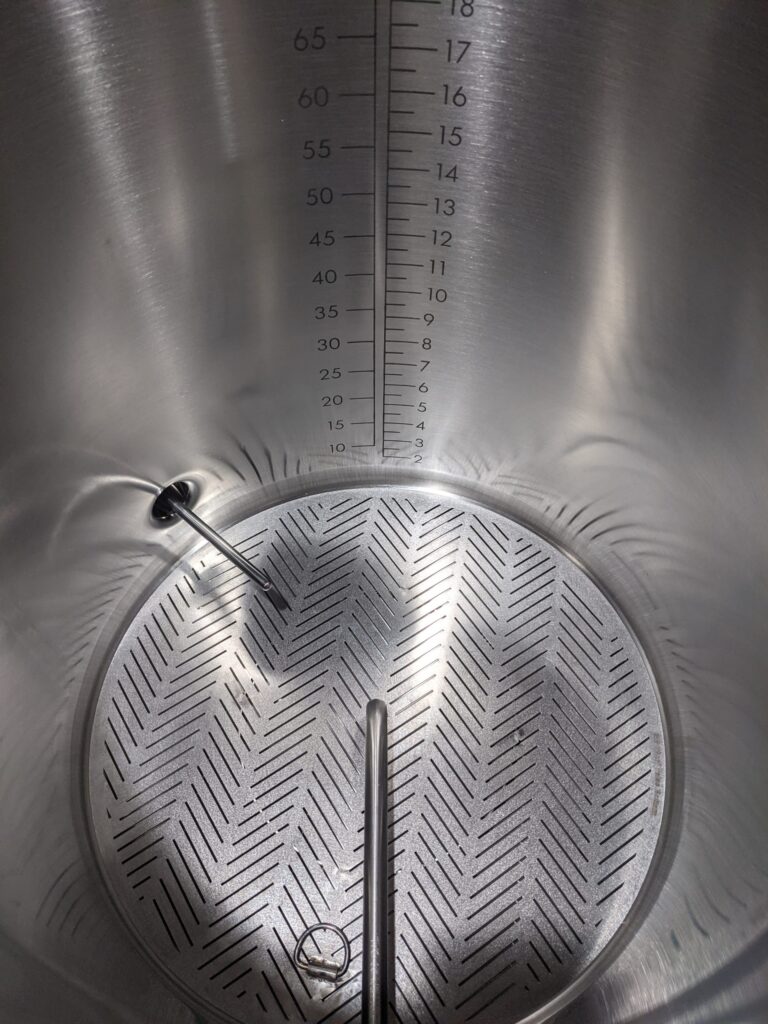
- Mike Cymerman from Spike Brewing who helped with the design and port locations for the custom kettles.
- Jerry Wasinger from Pi-Plates who helped troubleshoot some of the initial issues I ran into getting the code working for the THERMOplate.
- Matt Dunlop for drinking with me and keeping me company on my first brew day with the new system and telling me it was cool.